Titan



Titan is a self-hosted distributed runtime for DAGs, services, and agentic workflows, and it ships as a single 129 KB JAR with zero external dependencies. You can define your jobs in YAML or Python, build them visually in the browser, or even describe them in plain English through an AI client. Titan then handles capability routing and dependency execution across your cluster, running everything from a nightly ETL pipeline to a multi-agent LLM workflow.
Ready to dive in?
Skip the reading and jump straight into the code. Follow our 5-Minute Quickstart to run your first distributed task, or view the Python SDK Reference.
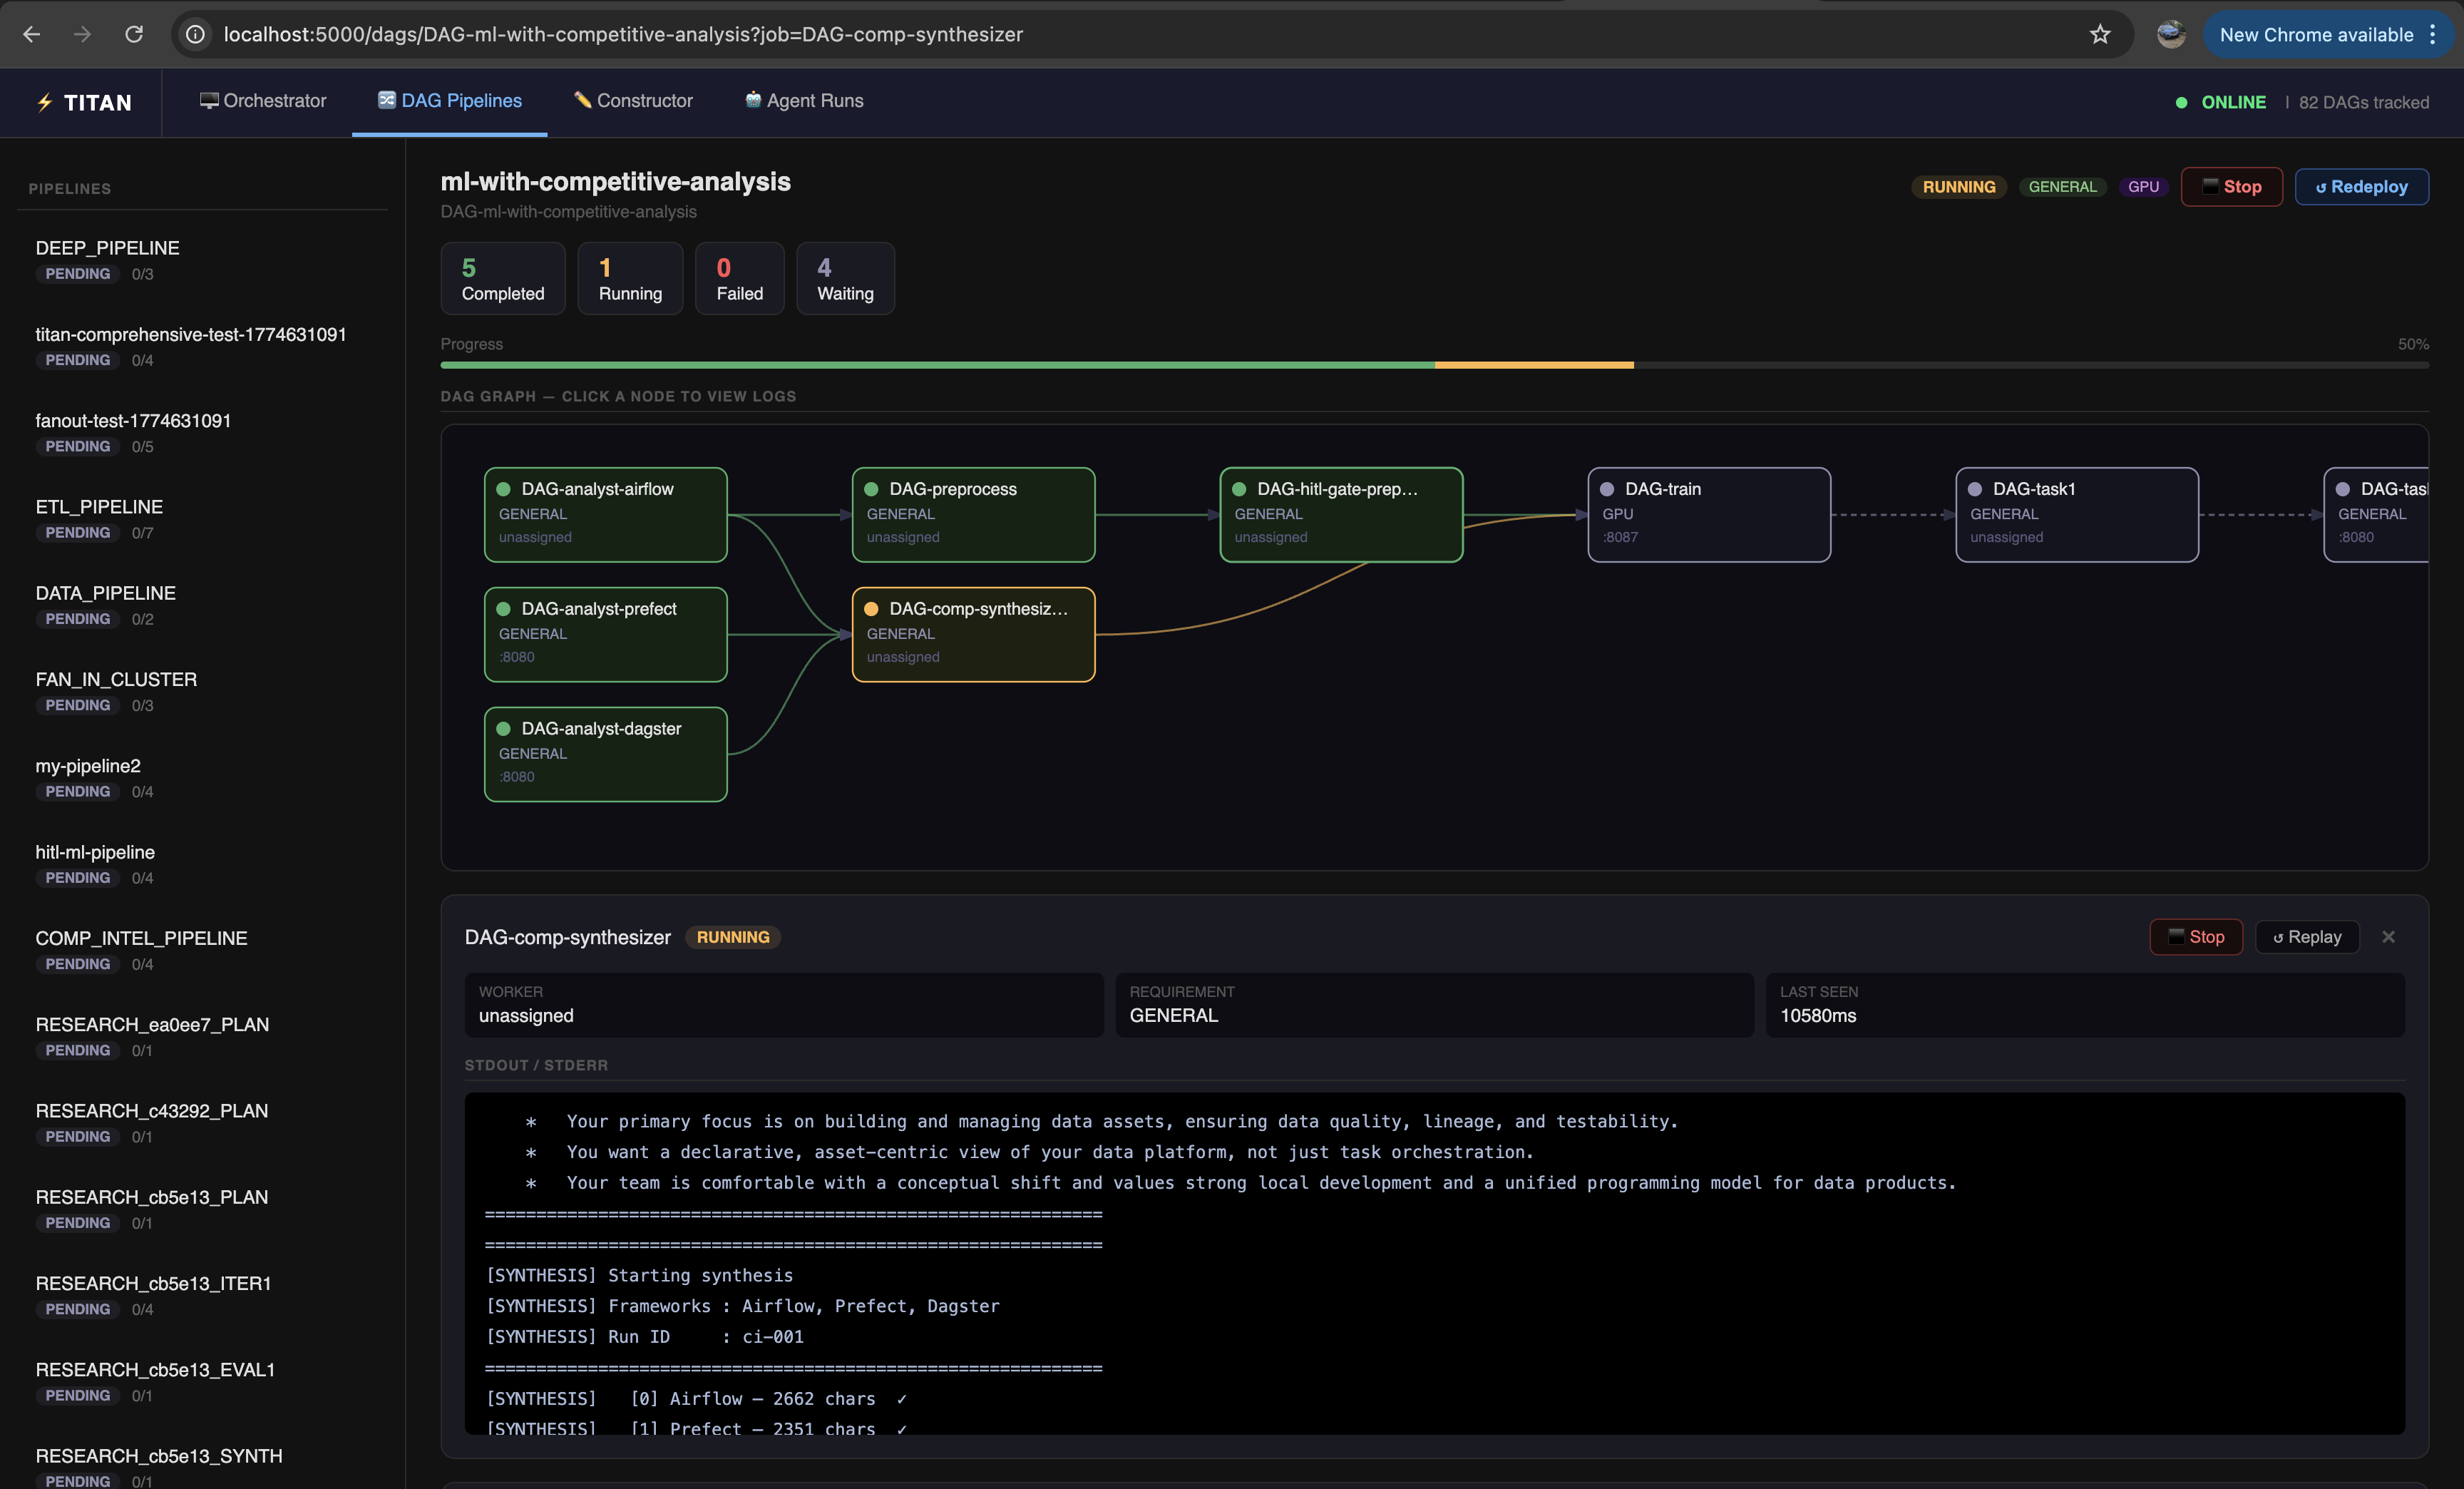
Live Pipeline Visibility: DAG Pipelines View
Every pipeline submitted to the cluster, via CLI, SDK, YAML, or the visual Constructor, is automatically rendered as a live dependency graph with real-time execution status per node.
Prefer slides?
Titan Runtime, in 31 slides covers the same ground as this site at a tenth of the length: why it exists, what it does, where it wins and where it plainly does not. Worth skimming first if you are deciding whether to read further.
Architecture Overview
A single Master acts as the control plane. It accepts submissions from clients, routes tasks to workers by load and capability, and uses TitanStore for state and crash recovery. Workers register themselves on startup; the Master holds no static worker config.
flowchart LR
    subgraph Clients["User / Clients"]
        direction TB
        SDK["Python SDK Agent"]
        YAML["YAML Pipeline"]
        Dash["Web Dashboard"]
    end

    subgraph ControlPlane["Titan Control Plane"]
        Master["Titan Master"]
    end

    subgraph DataLayer["State & Persistence"]
        Store[("Titan Store<br>(Optional)")]
    end

    subgraph Grid["Compute Grid"]
        direction TB
        W1["Worker Node"]
        W2["Worker Node"]
        W3["Worker Node"]
    end

    SDK -- "Submit Job" --> Master
    YAML -- "Submit Job" --> Master

    Master -- "Distribute" --> W1
    Master -- "Distribute" --> W2
    Master -- "Distribute" --> W3

    W1 -. "Data Bus (IPC)" .-> Master
    W2 -. "Data Bus (IPC)" .-> Master
    W3 -. "Data Bus (IPC)" .-> Master

    Master -. "Stream Stats" .-> Dash
    W1 -. "Live Logs" .-> Master

    Master <-->|"AOF / State / Data Bus"| Store

    classDef optional fill:#f9f9f9,stroke:#333,stroke-dasharray: 5 5;
    class Store optional;
Titan consists of three components:
- Control Plane (Master): DAG scheduling, dependency resolution, and capability routing
- Workers: Capability-tagged execution nodes that self-register on startup
- TitanStore (Optional & Swappable): Embedded AOF-backed persistence for crash recovery and shared agent state. No external database required, but not locked in either.
TitanStore is optional and replaceable. Titan is fully functional without it. Core execution and routing work regardless; you only lose state recovery and SDK-driven KV operations. And because Titan talks to it over the standard Redis wire protocol (RESP), TitanStore is a drop-in: point Titan at real Redis, KeyDB, or Valkey instead by setting
TITAN_REDIS_HOST/TITAN_REDIS_PORT(defaultlocalhost:6379). No adapter code to write; the same RESP client speaks to any of them. TitanStore just ships in the box so you get persistence with zero external dependencies.
Under the Hood
Titan's core is a distributed execution engine written from scratch: no orchestration framework, no message broker, no external database. The scheduler, the wire protocol, the failure handling, and the persistence layer are all hand-built and ship as a single zero-dependency JAR.
That constraint is the point: every dependency Titan doesn't take is a hard problem it solves itself, which is exactly why the engine is worth looking at.
| Layer | Built from scratch |
|---|---|
| Scheduler | Dependency resolution, capability + affinity routing, event-driven dispatch, blocked jobs cost nothing until a completion event unlocks them (no polling) |
| Transport | A custom 33-opcode binary RPC protocol over raw TCP, no gRPC, no Netty |
| Execution | Task runners behind one interface: ephemeral scripts, long-running services (with auto-restart), detached processes, zipped archives and file staging |
| Persistence | A from-scratch RESP-compatible store (AOF, KV, replication), swappable for real Redis |
| Concurrency | ~3,800 lines of framework-free Java: thread pools, atomics, and synchronized state coordinated across concurrent dispatch, heartbeat, and auto-scale loops |
Failure is a first-class concern
Titan implements 8 distinct failure-handling mechanisms: heartbeat detection with self-healing reschedule, bounded retry, a dead-letter queue, fail-fast on deterministic errors, orphaned-job recovery on restart, execution timeouts, saturation backpressure, and exponential-backoff callbacks. Handling partial failure (a worker dying mid-job, a Master restart, a lost result) is the part most from-scratch orchestrators skip. Titan treats it as a core transition, not an edge case.
🛡️ Fault Tolerance & Recovery 🔀 Execution Flows 🧠 System Design
Ways to Define a DAG
Titan accepts pipeline definitions in four forms. Pick whatever fits your workflow:
| Method | Best for | Where to start |
|---|---|---|
| YAML file | Repeatable, version-controlled pipelines. Define jobs, dependencies, requirements, and priorities in a declarative file. Commit to git and re-run any time. | Static YAML Pipelines |
| Python SDK | Programmatic pipelines where the shape is determined at runtime, agent loops, conditional branching, dynamic fan-out. Full control in code. | SDK Reference |
| Visual Constructor | Building pipelines without writing code. Drag nodes, draw edges, set scripts, then deploy directly to the cluster in one click. Auto-generates the equivalent YAML and SDK code. | DAG Constructor |
| MCP (natural language) | Controlling Titan from Claude Desktop, Cursor, or any MCP-compatible AI client. Describe what you want, the agent writes the scripts and submits the DAG on your behalf. | MCP / Agent Access |
All four paths produce the same result on the cluster, a DAG tracked in the visualizer, with per-job logs, status, and workspace files.
Wondering how Titan compares to Airflow, Dagster, Ray, or Temporal?
See the full breakdown, honest scoring, capability tiers, and a "when NOT to use Titan" section.
The Capability Spectrum
Titan is designed to grow with your system's complexity:
-
Tier 1: Distributed Cron (The "Scheduler") Execute Python scripts on remote machines in sequence or in parallel. Use the CLI or SDK to dispatch batch jobs, ETL pipelines, or any script-based workload across the cluster.
-
Tier 2: Service Orchestrator (The "Platform") Deploy long-running API servers and keep them alive, restarting them automatically on crash. Port management is handled by Titan.
Levels 1 + 2 work together
A common pattern: deploy an LLM inference server or a data API as a permanent service (Tier 2), then run batch scripts as jobs (Tier 1) that call that service. Both run inside the same Titan cluster, the service stays alive while jobs come and go around it.
-
Tier 3: Agentic Execution Runtime (The "Autonomous Mode") Programmatically construct execution graphs at runtime where software agents spawn downstream compute tasks conditionally based on LLM decisions or system states.
All three levels work together
Tier 3 doesn't replace the others, it orchestrates them. An agent can keep an LLM inference server running as a permanent service (Tier 2), dispatch batch analysis jobs that call it (Tier 1), and dynamically spawn further tasks based on what those jobs return, all within a single cluster. Titan manages the services, the jobs, and the agent's execution graph in one runtime.
Built-In Dashboard
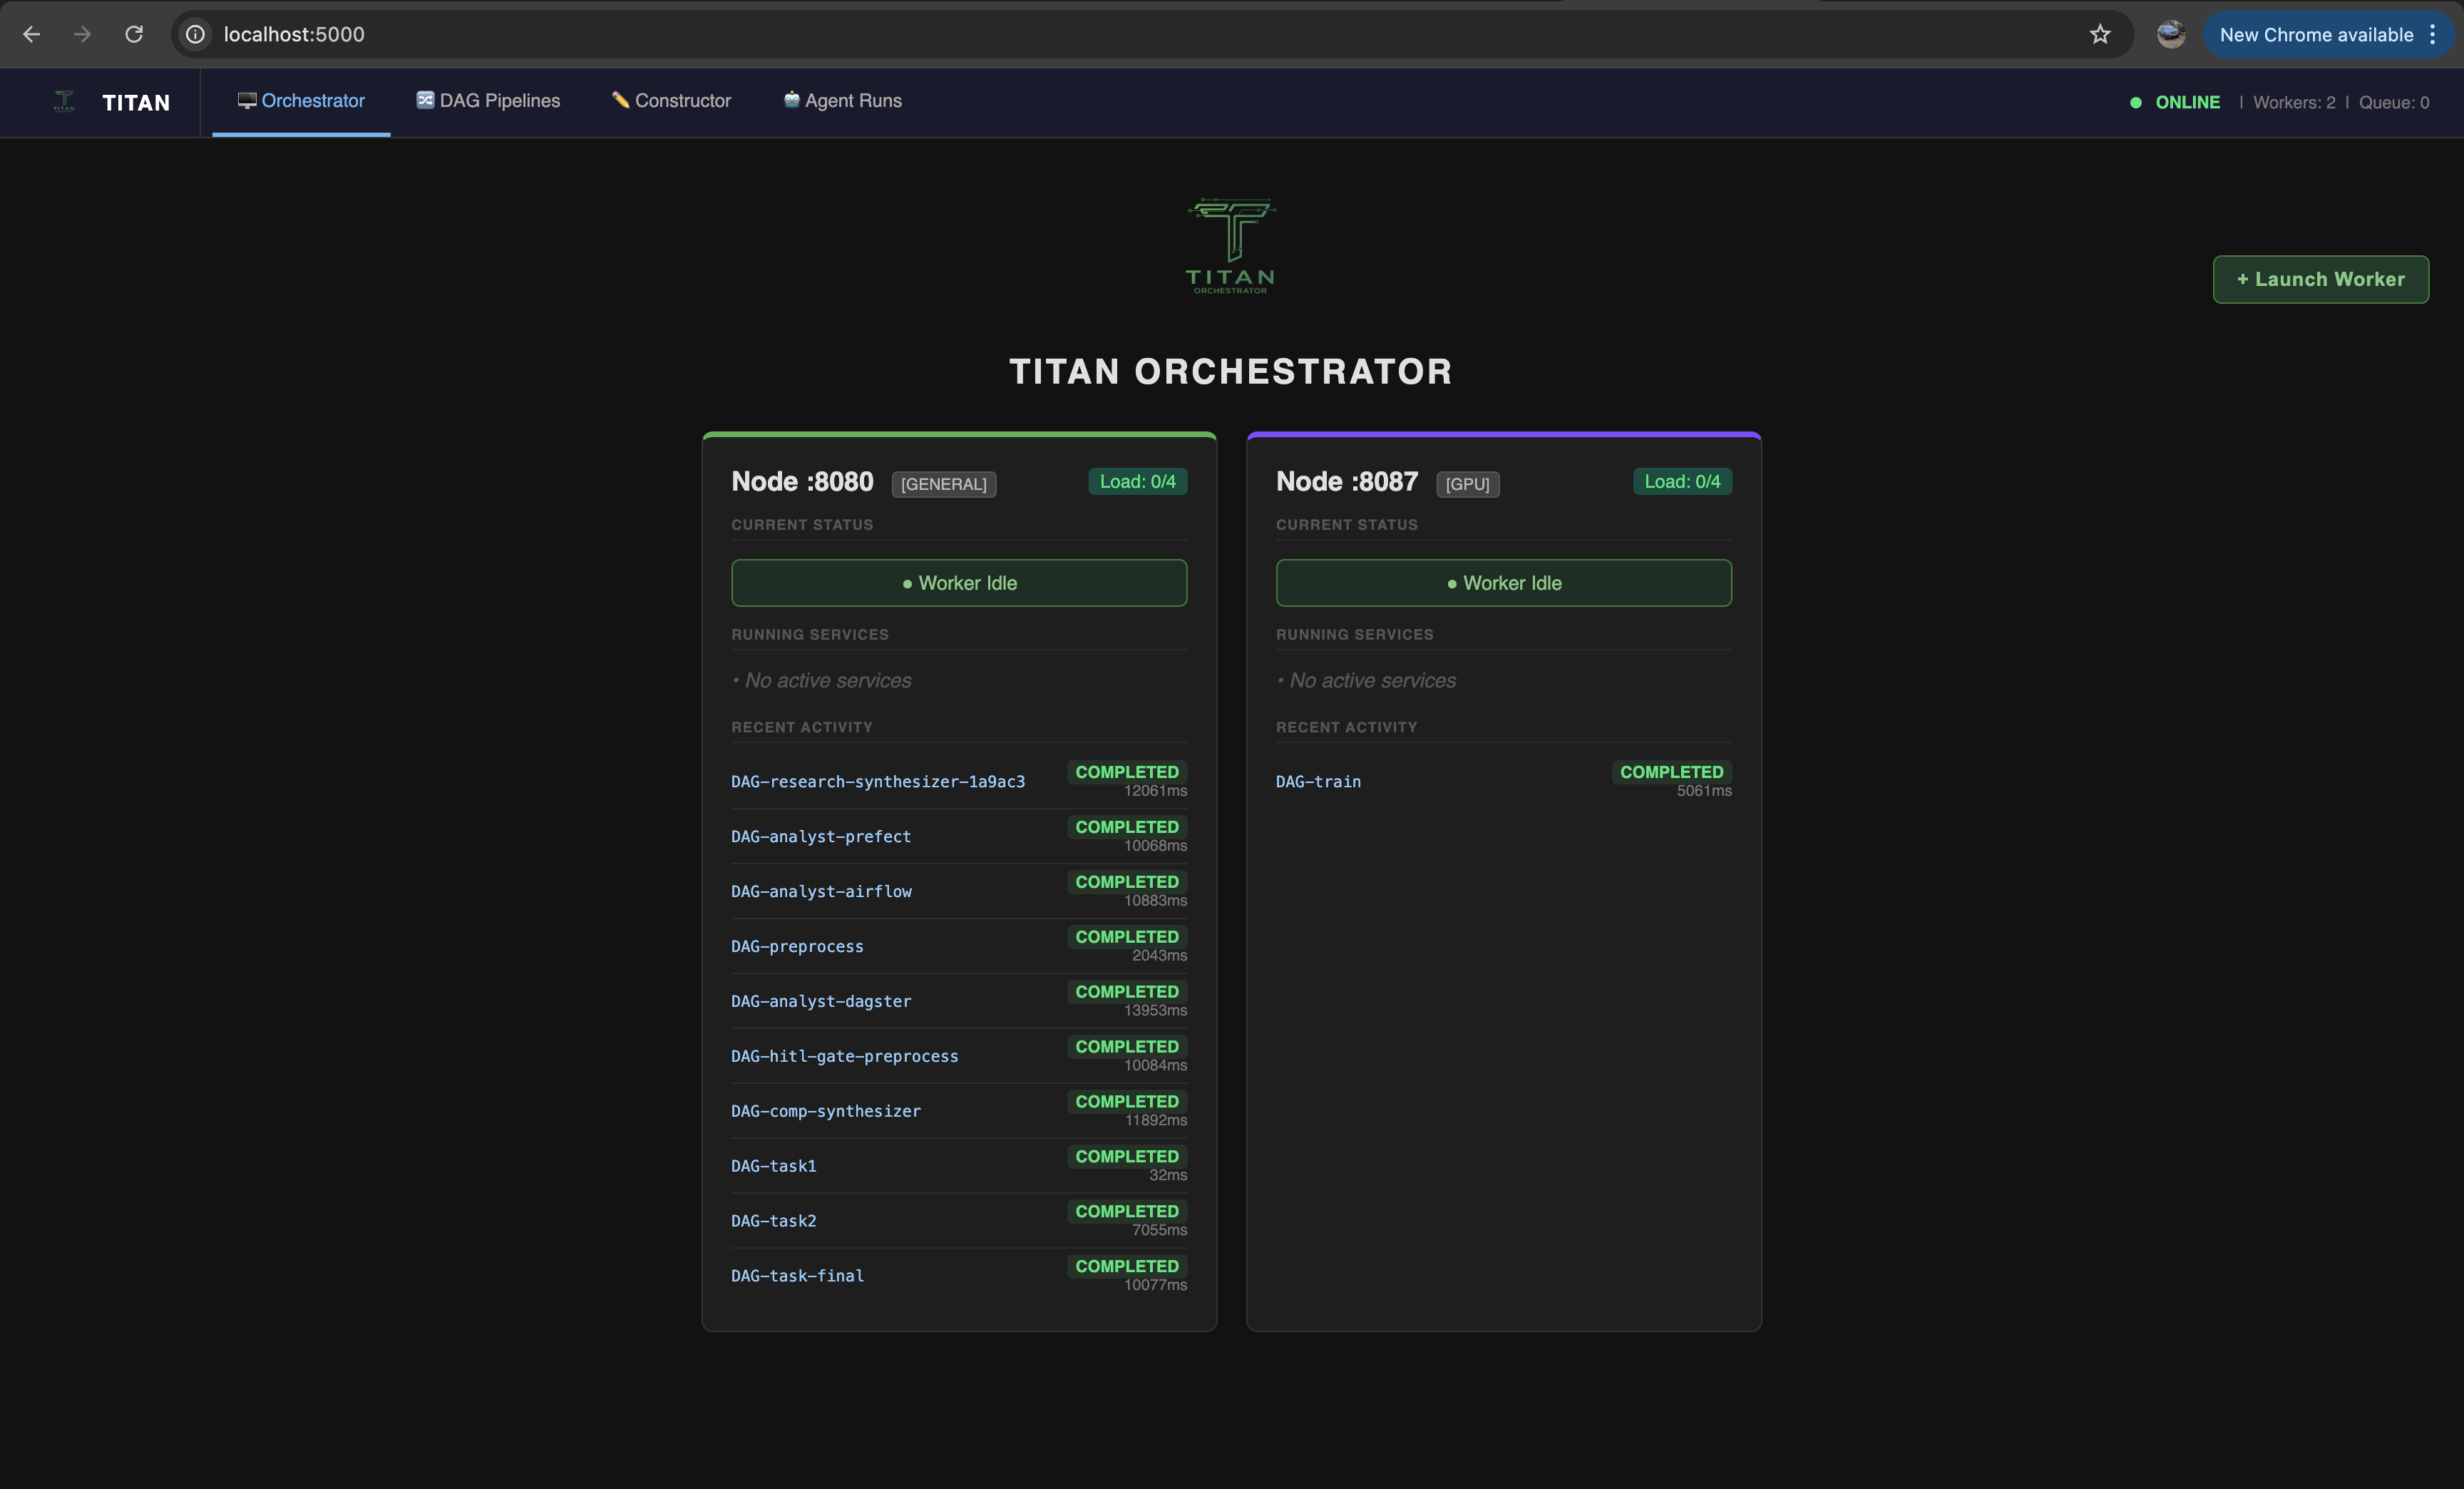
Titan includes a lightweight Python Flask dashboard to visualize cluster health, monitor worker load, and stream stdout/stderr from distributed jobs in real-time.
The dashboard ships with five views, in two groups.
Your pipelines:
- DAG Visualizer: live graph of any running or completed pipeline with status, logs, HITL approval, and workspace file downloads (live status is being reworked, see the note on that page)
- DAG Constructor: browser-based drag-and-drop builder for designing and deploying pipelines without writing code
- Agent Runs: groups multi-stage agent invocations into a single timeline row so you can track a full agent loop at a glance instead of hunting through individual DAG entries
The system running them, see Observability below:
- Execution Timeline: every dispatch on a real time axis, with the wait before each job separated from its execution
- Cluster & Control Plane: the scheduler's own state: what is queued and why, where dispatch time goes, worker and store health
For the dashboard you will need Flask as external dependency (The core engine has zero dependencies, this is an extension)
The dashboard does not have to run on the Master
It is a client of the Master, talking to it over the same TCP protocol as any other client, so
it can run on your laptop while the cluster runs elsewhere. Point it at the Master with
TITAN_MASTER_HOST and TITAN_MASTER_PORT (defaults 127.0.0.1 and 9090):
DAG Visualizer
Every pipeline appears here as a live dependency graph, regardless of how it was submitted (CLI, SDK, YAML, or Constructor). Node colors update in real-time as jobs move through PENDING → RUNNING → COMPLETED / FAILED.
For agentic workflows, the graph grows as the agent submits new work. Use the Agent Runs view for the high-level timeline across all stages, then click into any stage to drill down into its node graph and live logs here.
Visual DAG Constructor
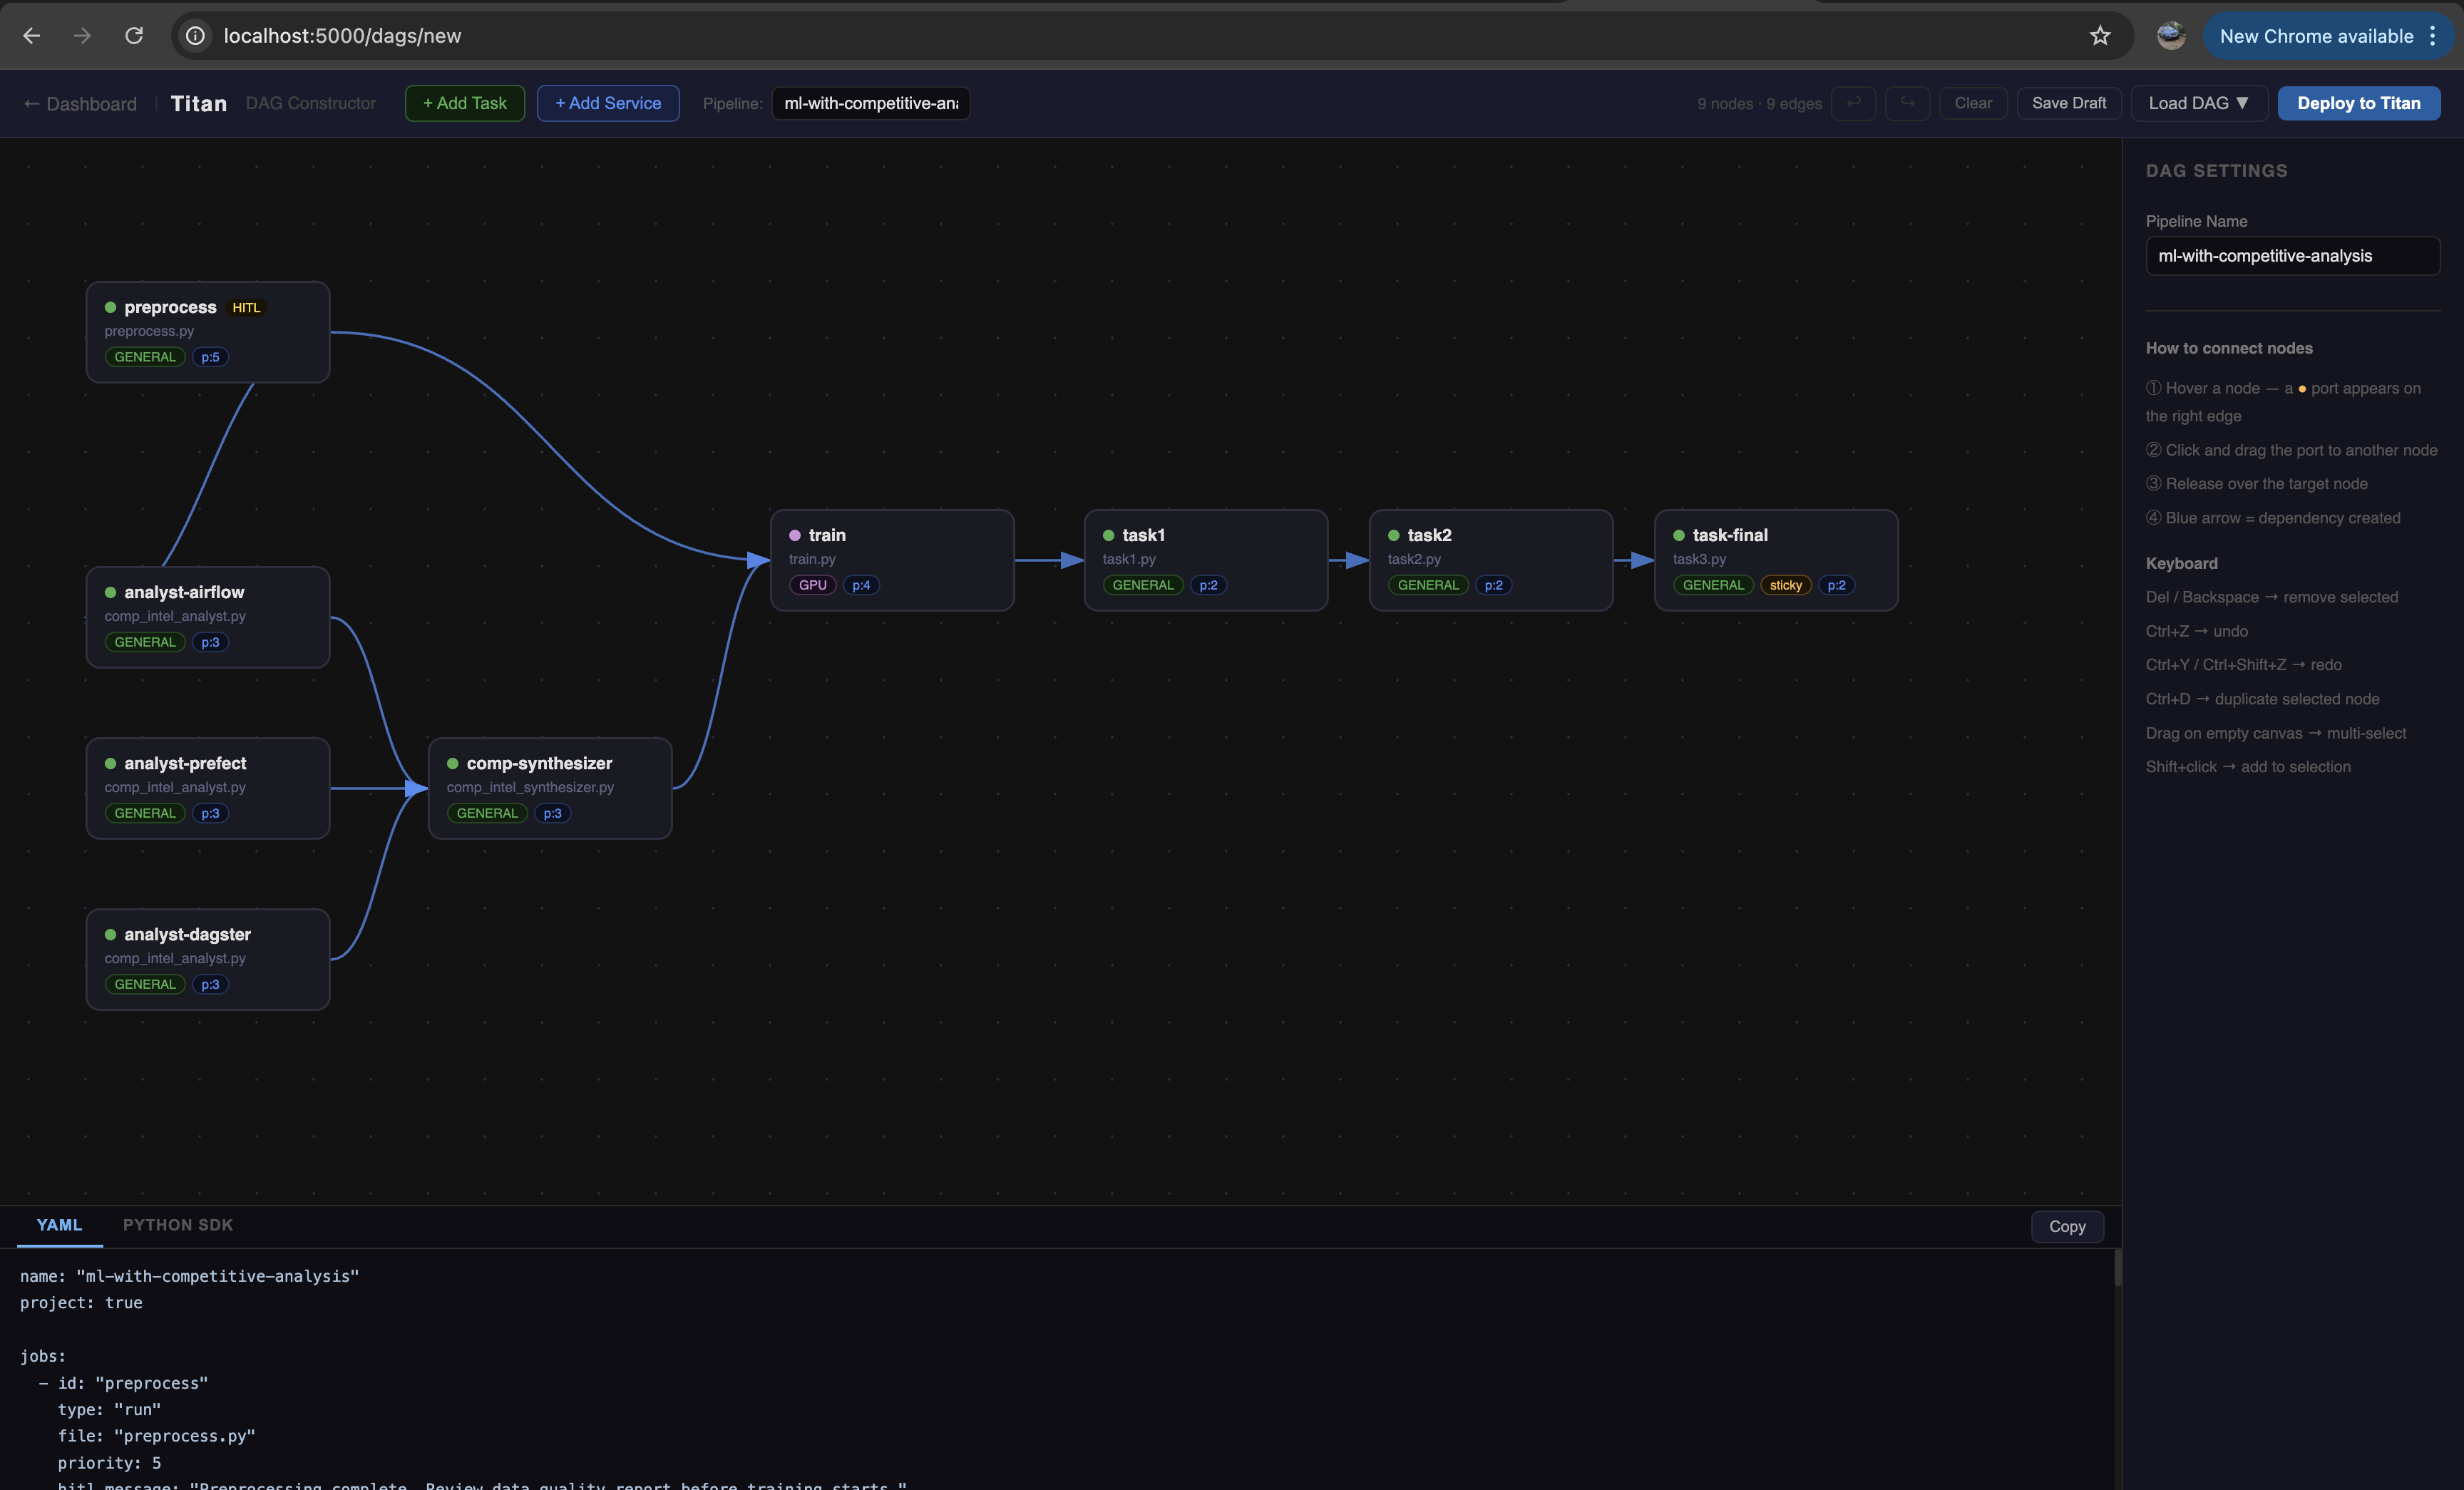
Build and deploy pipelines without writing any code. Drag nodes onto the canvas, draw edges to define dependencies, configure each job's script, requirements, and priority, then hit Deploy to submit directly to the cluster.
The Constructor also auto-generates the equivalent Python SDK and YAML definitions, which you can copy for reuse in automated pipelines.
Prerequisite
The Deploy button submits jobs by reading script files from the Master's perm_files directory. Ensure the script files you reference in the Constructor have been created and staged to perm_files before deploying.
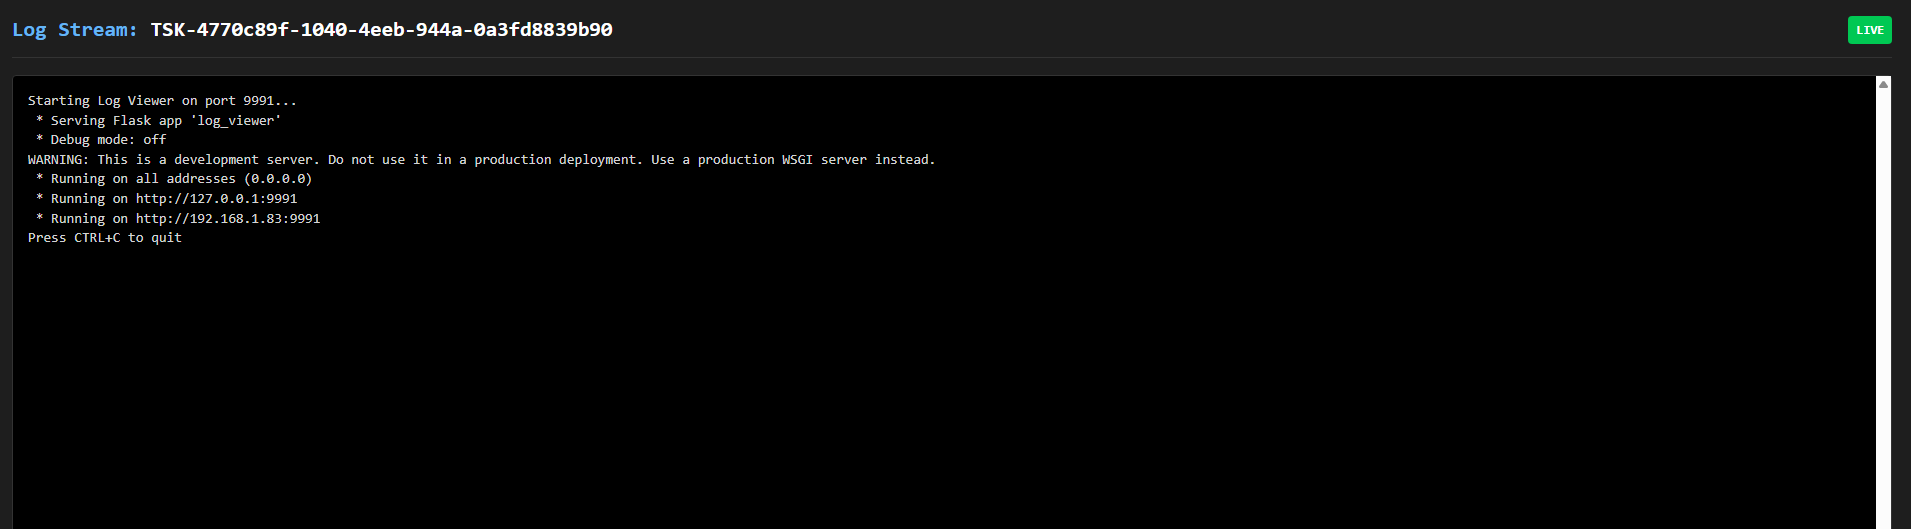
Live Log streaming
Monitor remote worker execution directly from the control plane UI in real-time.
Observability
The views above answer what ran. These two answer why it took as long as it did, and they need no metrics stack, exporter or Grafana. Everything is sampled inside the Master and served from the same process.
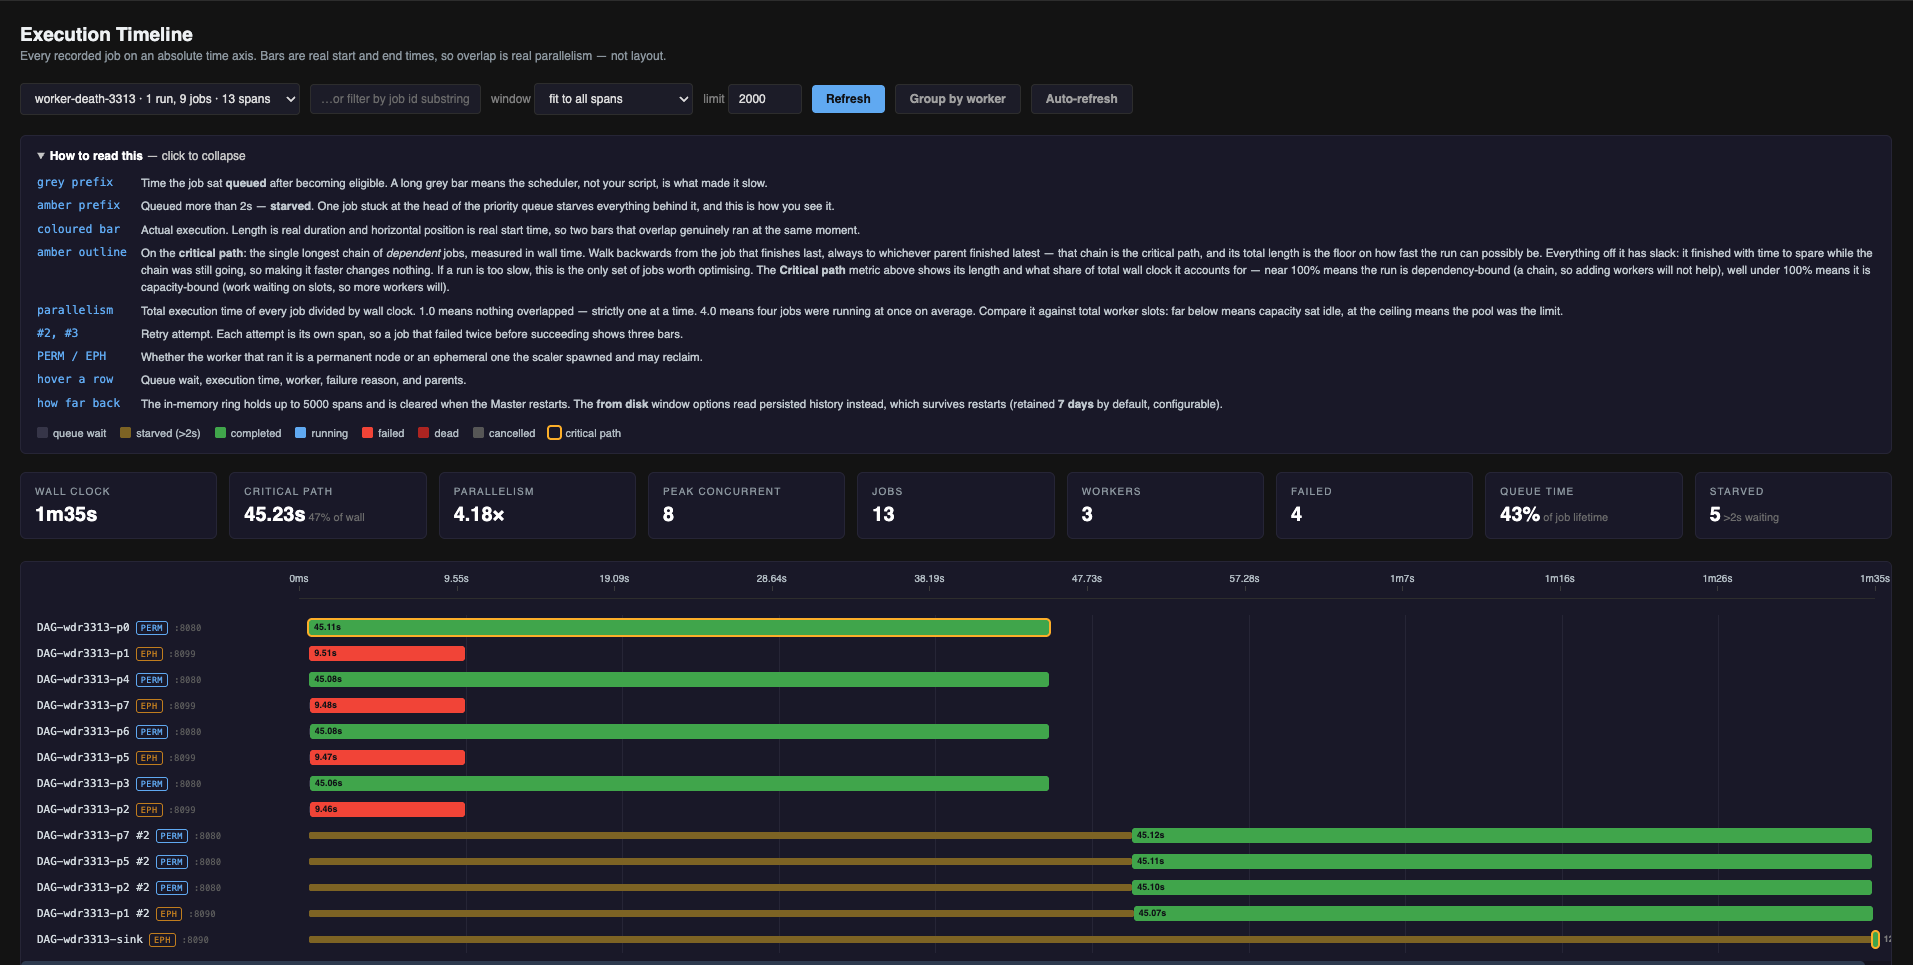
Execution Timeline
Every job dispatch on an absolute time axis. Each bar records when the job became eligible and when it actually started, so the time it spent queued is shown separately from the time it spent running. Those two are what a status view cannot separate.
What it gives you:
- Where the wall clock went: queued versus executing, per job
- Real parallelism: bars that overlap ran at the same moment, so you can see whether work genuinely ran concurrently
- The critical path: the longest chain of dependent jobs, and what share of the run it accounts for. A high share means adding workers will not help; a low share means it will
- Retries as separate attempts: a job retried twice draws three bars rather than one
- Failure reasons: script failure, a service that never bound its port, and a worker that never replied are distinguished, because they need different fixes
Spans are held in memory and also written to disk for 7 days, so a post-mortem survives a Master restart.
Full reference: Execution Timeline
Cluster & Control Plane
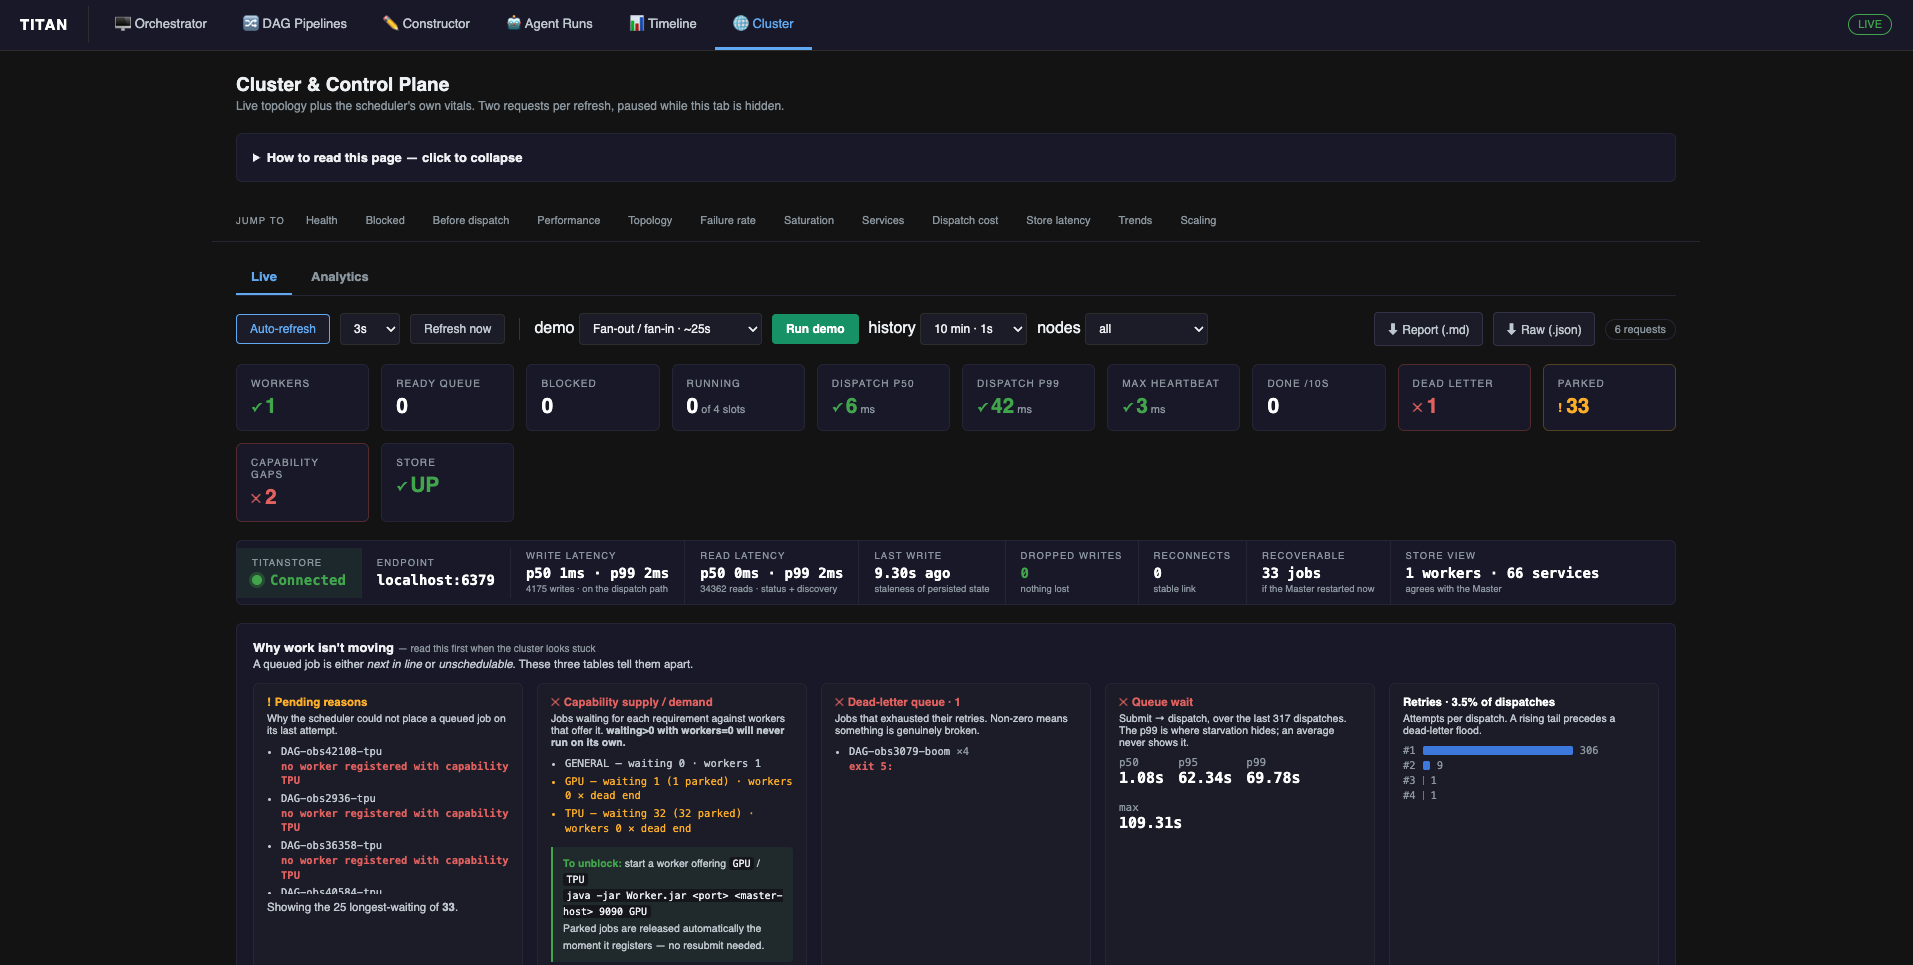
The scheduler's own state and vitals, on two sub-tabs: Live for what is happening now, Analytics for how it has been trending.
What it gives you:
- Why work is not moving: pending reasons in the scheduler's own words, capability dead ends with the command that fixes them, and the four pre-dispatch lanes (delayed, blocked, ready, parked) that a single "pending" count cannot distinguish
- Where the scheduler's own time goes: the dispatch loop is serialized, and it is broken down into routing, worker selection, bookkeeping, store writes and the network hand-off, with a share table
- Cluster health: topology with per-node slot occupancy and host CPU / memory / load, heartbeat round-trip, saturation, failure rate, store read and write latency, and scaling history with the reason recorded for every scale-up and descale
- Long-running work: a roster of live services with the address a caller would dial, uptime and host node; services appear nowhere else, since they have no duration
- Trends: success rate, duration distribution, queue-wait percentiles, per-worker utilisation, queue wait by declared priority, and pipeline duration across runs
- A demo runner: seven preset workflows that put the cluster into a known state, for showing the dashboard to someone
Full reference: Cluster & Control Plane
Demos
1. Visual DAG Constructor
Build a pipeline by dragging nodes and drawing edges, then deploy directly to the cluster with one click.
2. Human-in-the-Loop (HITL) Gate
A DAG pauses at a checkpoint and waits for a human Approve/Reject before downstream jobs resume.
3. HITL on a Complex Graph
HITL gate mid-execution on a multi-branch pipeline, shows how the visualizer reflects the paused state.
4. Agentic AI Workflow
A multi-stage agent loop, each stage is a separate DAG submission, grouped into a single timeline in the Agent Runs view.
View More: Dynamic DAG Execution, Reactive Scaling, GPU Routing, Fanout
**Control Plane: Dynamic DAG Execution** **Reactive Worker Scaling** **GPU Affinity Routing** **Parallel Execution (Fanout)** **Full Load Cycle (Scale Up & Descale)**
Examples
The titan_test_suite/ directory has ready-to-run examples for every capability tier:
| Example | What it shows |
|---|---|
| Build Your First Agent (10 min) | Writer → Critic loop, simplest agentic pattern in ~60 lines |
| Human-in-the-Loop Pipeline | ML pipeline that pauses for human Approve/Reject before training |
| Multi-Agent Research Pipeline | Parallel agents + HITL gate + synthesis fan-in |
| Static YAML Pipelines | Diamond patterns, GPU routing, parallel fan-out |
MCP / Agent Access
Titan ships with a built-in MCP server, connect any MCP-compatible client (Claude Desktop, Cursor) and control your cluster in natural language.
Why use MCP over the SDK directly?
| Situation | Use MCP |
|---|---|
| You want to submit and monitor pipelines without writing code | Yes |
| Your pipeline shape isn't known upfront, the agent decides at runtime | Yes |
| You need a durable HITL approval flow in a chat conversation | Yes |
| You want to schedule recurring pipelines without a separate cron setup | Yes |
| You're building automated pipelines in code | No, use the SDK or LangChain directly |
Real example: ask Claude Desktop to audit 10 doc pages in parallel, fan results into a consolidation job, and render a rated report, all from one sentence. Titan executed a 12-job DAG; Claude never left the chat window.
LangChain / LangGraph
If you're building agent pipelines in code rather than through an interactive client, wrap the Titan SDK as LangChain tools and use any LLM. No MCP needed, TitanClient is called directly.
from langchain_core.tools import tool
from titan_sdk.titan_sdk import TitanClient, TitanJob

@tool
def titan_get_status(job_id: str) -> str:
    """Get the current status of a Titan job."""
    client = TitanClient()
    prefixed = job_id if job_id.startswith("DAG-") else f"DAG-{job_id}"
    return client.get_job_status(prefixed)
LangChain is optional, not a Titan dependency. A self-contained validation script with all five core tool wrappers is at examples/langchain_titan.py.
Deployment
Titan runs locally out of the box. When you're ready to move to the cloud:
| Setup | When to use |
|---|---|
| Multi-VM Cloud Setup | Permanent cluster on GCP / AWS / Azure, Master on a VM, workers on VMs |
| Remote GPU Worker via SSH Tunnel | Keep your local machine as the Master, tunnel a remote GPU (RunPod, cloud VM) as a worker, no open ports needed |
API & SDK Reference
- Python SDK Reference:
TitanClient,TitanJob, TitanStore, artifacts, and agent patterns - CLI Commands: Spin up Master, boot Workers, submit jobs from the terminal
- Java Core Engine: Internal class docs (
Scheduler,RpcWorkerServer, etc.)
Roadmap to v2.0
- Visual DAG Constructor: Browser-based drag-and-drop DAG editor with YAML/SDK code generation and one-click deploy.
- Distributed Consensus: Implement Raft or Paxos for Leader Election to remove the Master node as a Single Point of Failure (SPOF).
- Security & Auth: Implement mTLS (Mutual TLS) for encrypted, authenticated cluster communication.
- Containerized Execution: Add support for Docker execution drivers to provide true filesystem isolation (currently utilizing Process-Level isolation).
- Service readiness gate: A service deploy completes only once its port accepts connections, so downstream DAG nodes never race a slow-booting server. Fails fast if the port never binds.
- Service discovery (address): The Master records each live service's real host and port;
get_service_address()/get_service_url()/list_services()resolve it at runtime instead of hardcoding. - Service health checking: Periodic TCP/HTTP probes per service, crash-loop backoff with a restart ceiling, and restart state surfaced to the dashboard.
- Logical service names & env injection: Stable names that survive redeploys, plus
TITAN_SVC_<NAME>_HOST/PORTinjected into any job that declaresneeds_services. - Cluster Autoscaler Webhooks: Allow Titan to trigger external APIs (e.g., Azure VM Scale Sets, AWS EC2) to provision bare-metal compute automatically when queues saturate.
- Opt-in TTL heartbeat: Offer push-style worker liveness via TitanStore TTL keys (worker refreshes an expiring key; Master detects absence) as an alternative to the current Master-dial loop. Requires exposing a
SETEX-style command over the wire, and would make TitanStore required for liveness, so it stays opt-in, with the dial loop remaining the store-less default. - Human-in-the-Loop (HITL): Pause DAG execution and wait for human Approve/Reject via the Dashboard. Supports per-gate timeouts and automatic gate injection via the SDK. See HITL Pipelines.
Project Status & Contributing
Titan is a custom-built, experimental runtime engineered from first principles by a single developer. While it successfully handles complex distributed execution loops and agentic workflows, it is currently in v1.0 Research Status.
Because distributed systems are inherently complex, you may encounter edge cases or network timeouts in non-standard environments. If you find a bug, break the orchestrator, or want to help harden the core engine, contributions are highly encouraged!
🐛 Report an Issue 🤝 How to Contribute
🚀 Quickstart: Run your first distributed task in 5 minutes 🧠 Read the Architecture Deep Dive