Monitoring & Logs
Job status colours
Each node in the pipeline graph is colour-coded to reflect the current job state:
| Colour | Status | Meaning |
|---|---|---|
| Gray | PENDING |
Waiting for dependencies to complete, or for a worker |
| Blue (pulsing) | RUNNING |
Actively executing on a worker |
| Green | COMPLETED |
Finished successfully |
| Red | FAILED |
Exited with a non-zero code or was rejected |
| Muted / dim | CANCELLED |
Cancelled due to an upstream failure or manual stop |
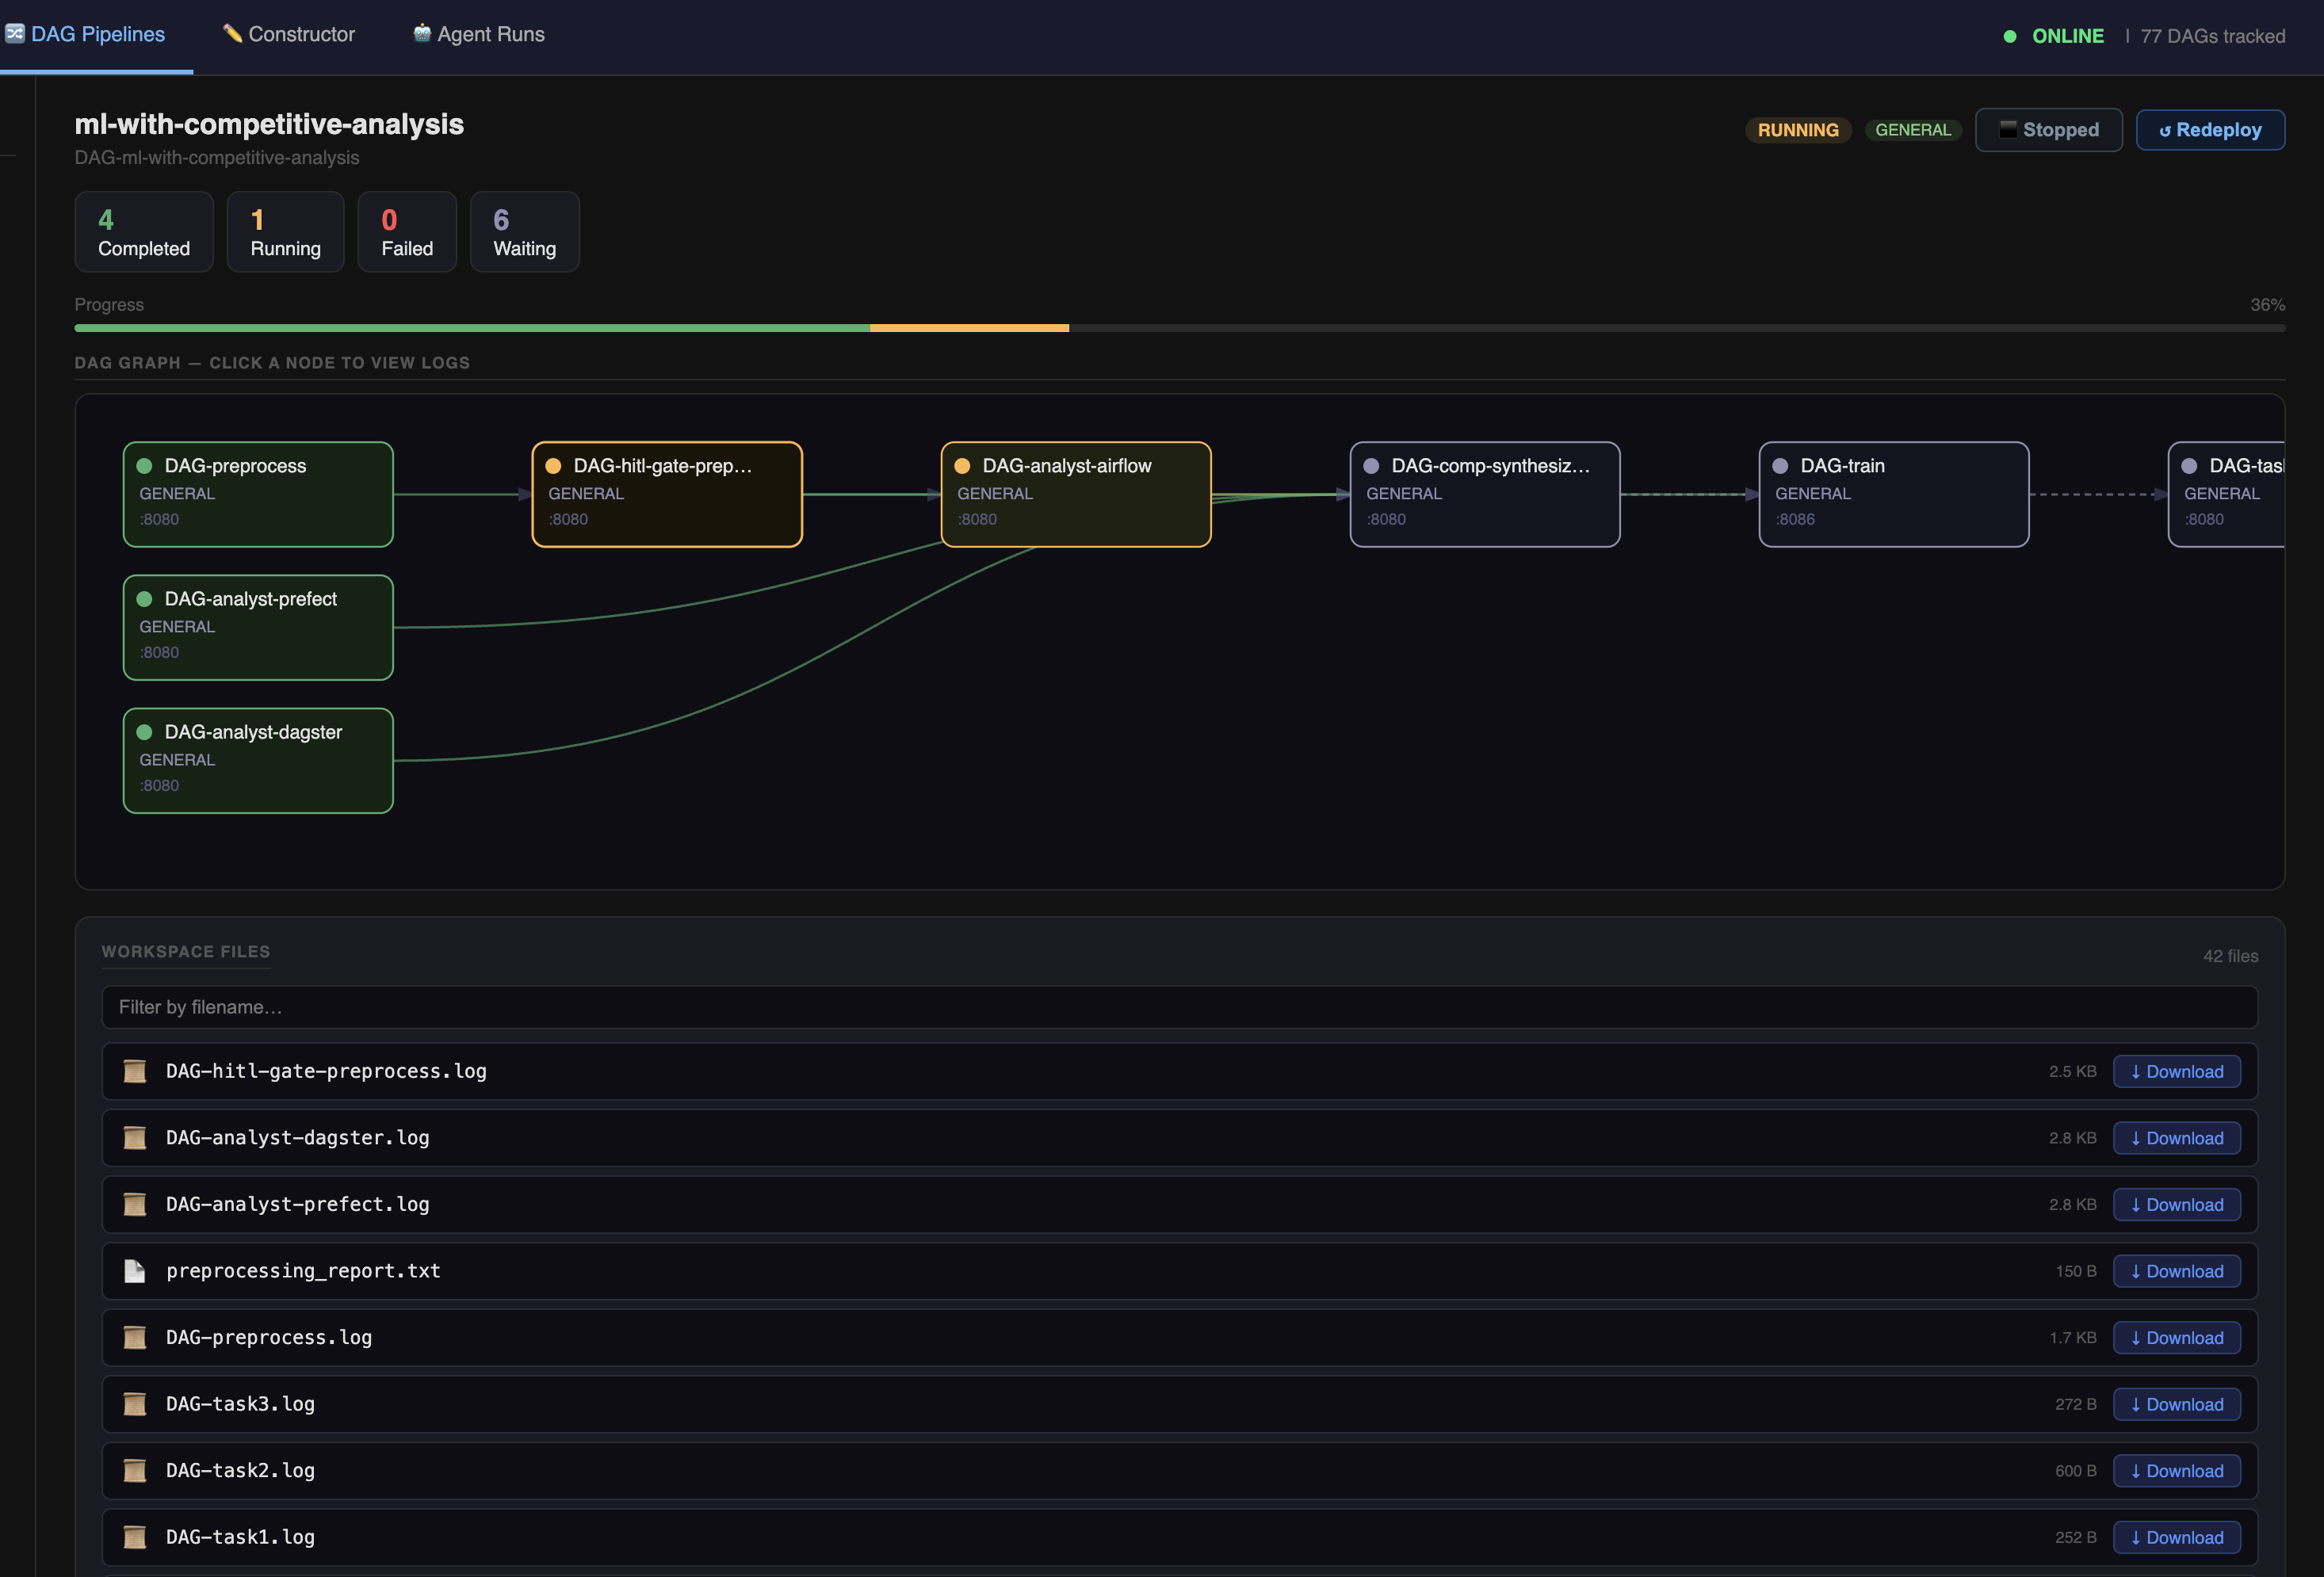
Reading the graph
Edges (arrows) show dependency direction: an arrow from A to B means B depends on A.
- Jobs at the top (no incoming edges) run first
- Jobs fan out in parallel when their shared dependency completes
- Fan-in jobs (multiple incoming edges) wait for all parents
HITL gate nodes appear as regular nodes in the graph — they show as RUNNING while waiting for approval and COMPLETED once approved.
Viewing job logs
Click any node in the graph to open its log panel on the right side of the screen.
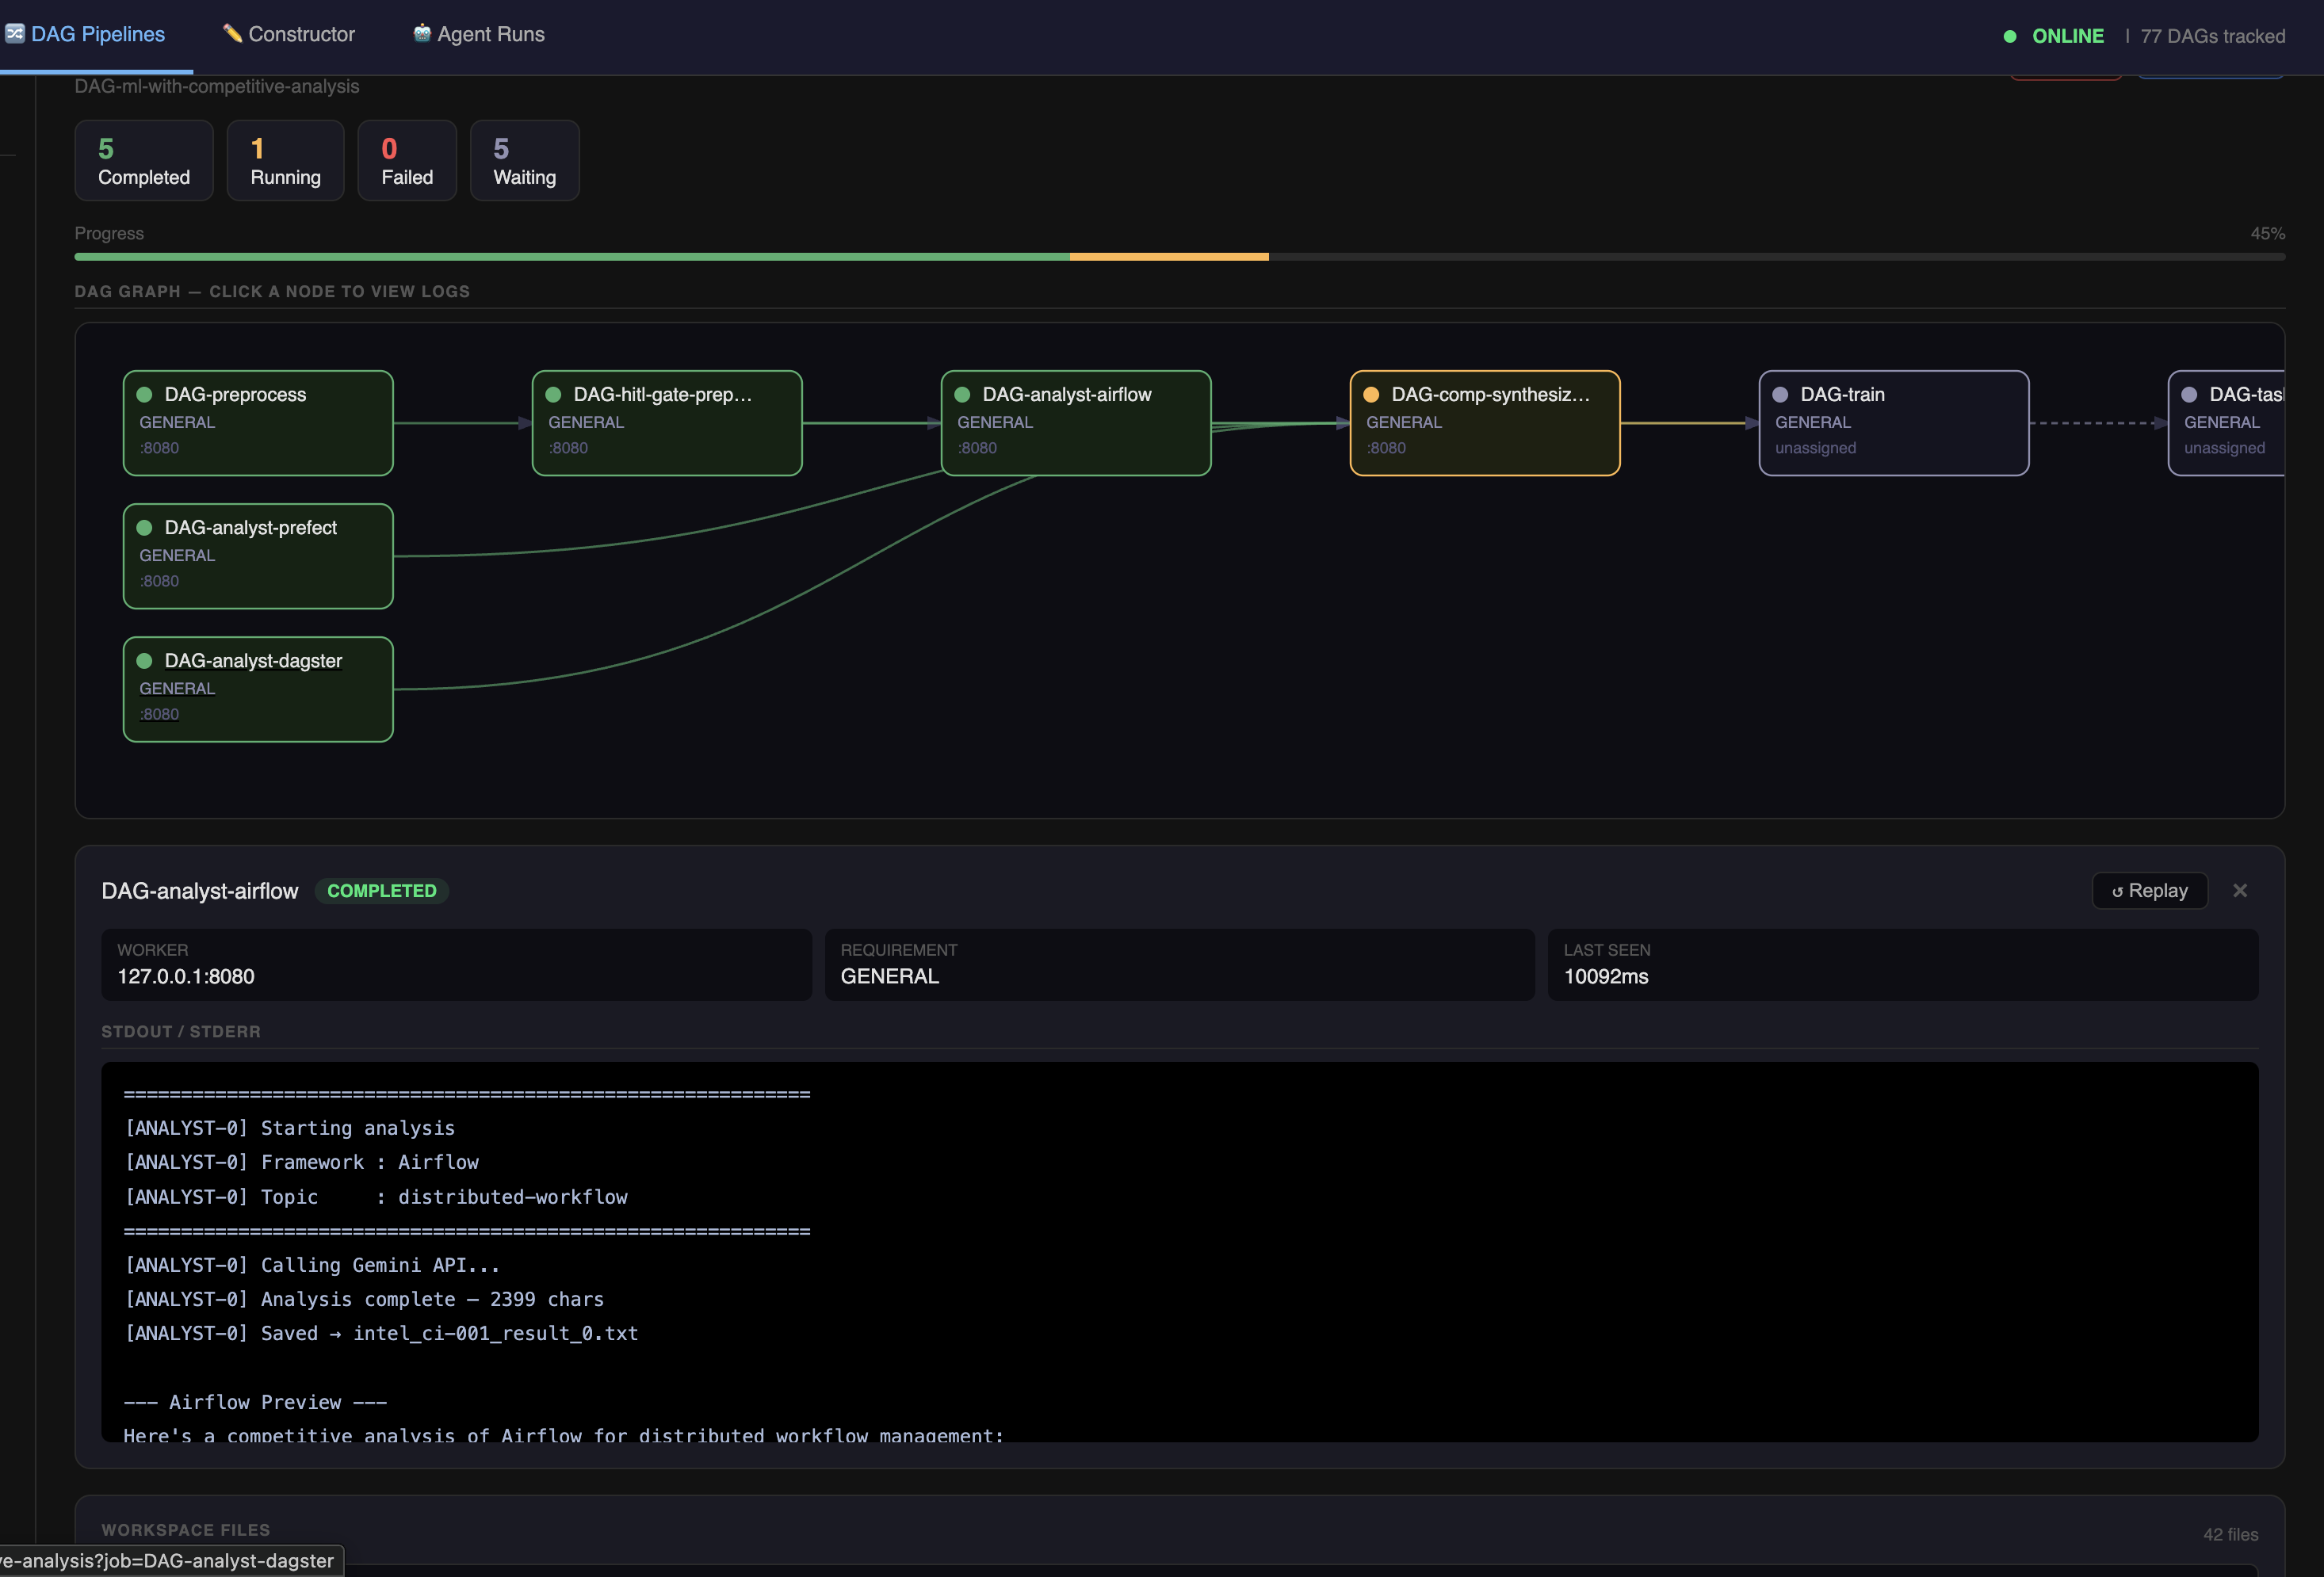
The log panel shows:
- Raw stdout and stderr from the worker process
- Auto-refreshes every 2 seconds while the job is
RUNNING - Full output available for completed and failed jobs
- Scroll to follow the tail as new lines arrive
Logs are fetched from /api/logs_raw/<job-id> and are stored in titan_workspace/shared/DAG-<job-id>.log.
Diagnosing a failure
When a job shows red (FAILED):
- Click the node to open its log panel
- Scroll to the bottom — the error or traceback appears at the end
- Common causes: wrong args format, missing dependency, script exception, worker OOM
DAG list view
http://127.0.0.1:5000/dags shows all submitted DAGs with:
- DAG name
- Overall status (derived from job statuses)
- Total job count
- Link to the individual visualizer
Screenshot needed
visualizer_dag_list.png — DAGs list page with multiple pipelines
Stopping a job
Running jobs can be stopped from the dashboard. A stopped job transitions to CANCELLED and downstream dependents do not run.