Agent Runs
Why this view exists
In a regular pipeline, the full DAG is known before execution starts. You submit one graph, watch it run, it finishes. The DAG Pipelines view handles this well — one entry, one graph.
Agents are different. An agent does not know its full execution plan upfront. It reasons at runtime:
- A Planner stage runs first — an LLM decides what subtopics to investigate, how many workers to spawn, what the next step should be
- Based on the planner's output, the orchestrator submits a new Researcher DAG with N parallel workers (N was unknown before the planner ran)
- An Evaluator stage reads the results and decides: synthesize now, or loop and go deeper?
- If looping, a second Researcher DAG is submitted — again with a shape determined at runtime
- Eventually a Synthesizer DAG fans in everything into a final report
Each of these is a separate DAG submission — not nodes within one DAG. The orchestrator (Python code running between stages) bridges them by reading TitanStore, making decisions, and calling submit_dag() again.
This means in the DAG Pipelines view, one agent run produces many unrelated-looking entries scattered across the list:
RESEARCH_1a9ac3_PLAN
RESEARCH_1a9ac3_ITER1
RESEARCH_1a9ac3_EVAL1
RESEARCH_1a9ac3_ITER2
RESEARCH_1a9ac3_EVAL2
RESEARCH_1a9ac3_SYNTH
Without context, these look like six independent pipelines. With 3–4 concurrent agent invocations, the list becomes unnavigable. Agent Runs was added to solve this — it groups all stages that share an agent_run_id into a single row so you can see the full lifecycle of one agent at a glance, track which iteration it is on, and spot failures in context.
How agent DAGs differ from regular DAGs
| Regular DAG | Agent DAG stage | |
|---|---|---|
| Graph shape at submit time | Fully known | Unknown — decided by the previous stage |
| Number of stages | One | Multiple, determined at runtime |
| Who bridges stages | Nothing — it's one graph | The orchestrator (Python), running between submissions |
| State between stages | Not needed | Passed via TitanStore (shared KV) |
| Visualizer entry | One entry in DAG Pipelines | One entry per stage + grouped in Agent Runs |
| Failure scope | Whole DAG stops | Only that stage fails — orchestrator can retry or reroute |
The key insight: a Titan agent is a loop around submit_dag(), not a special graph type. Titan's runtime doesn't know or care that stages are related — that's the orchestrator's job. Agent Runs is purely a dashboard convenience that reads the agent_run_id tag to reconstruct the full picture.
The view
The Agent Runs view at http://127.0.0.1:5000/agents groups all stages that share an agent_run_id into a single row, shown left to right in submission order.
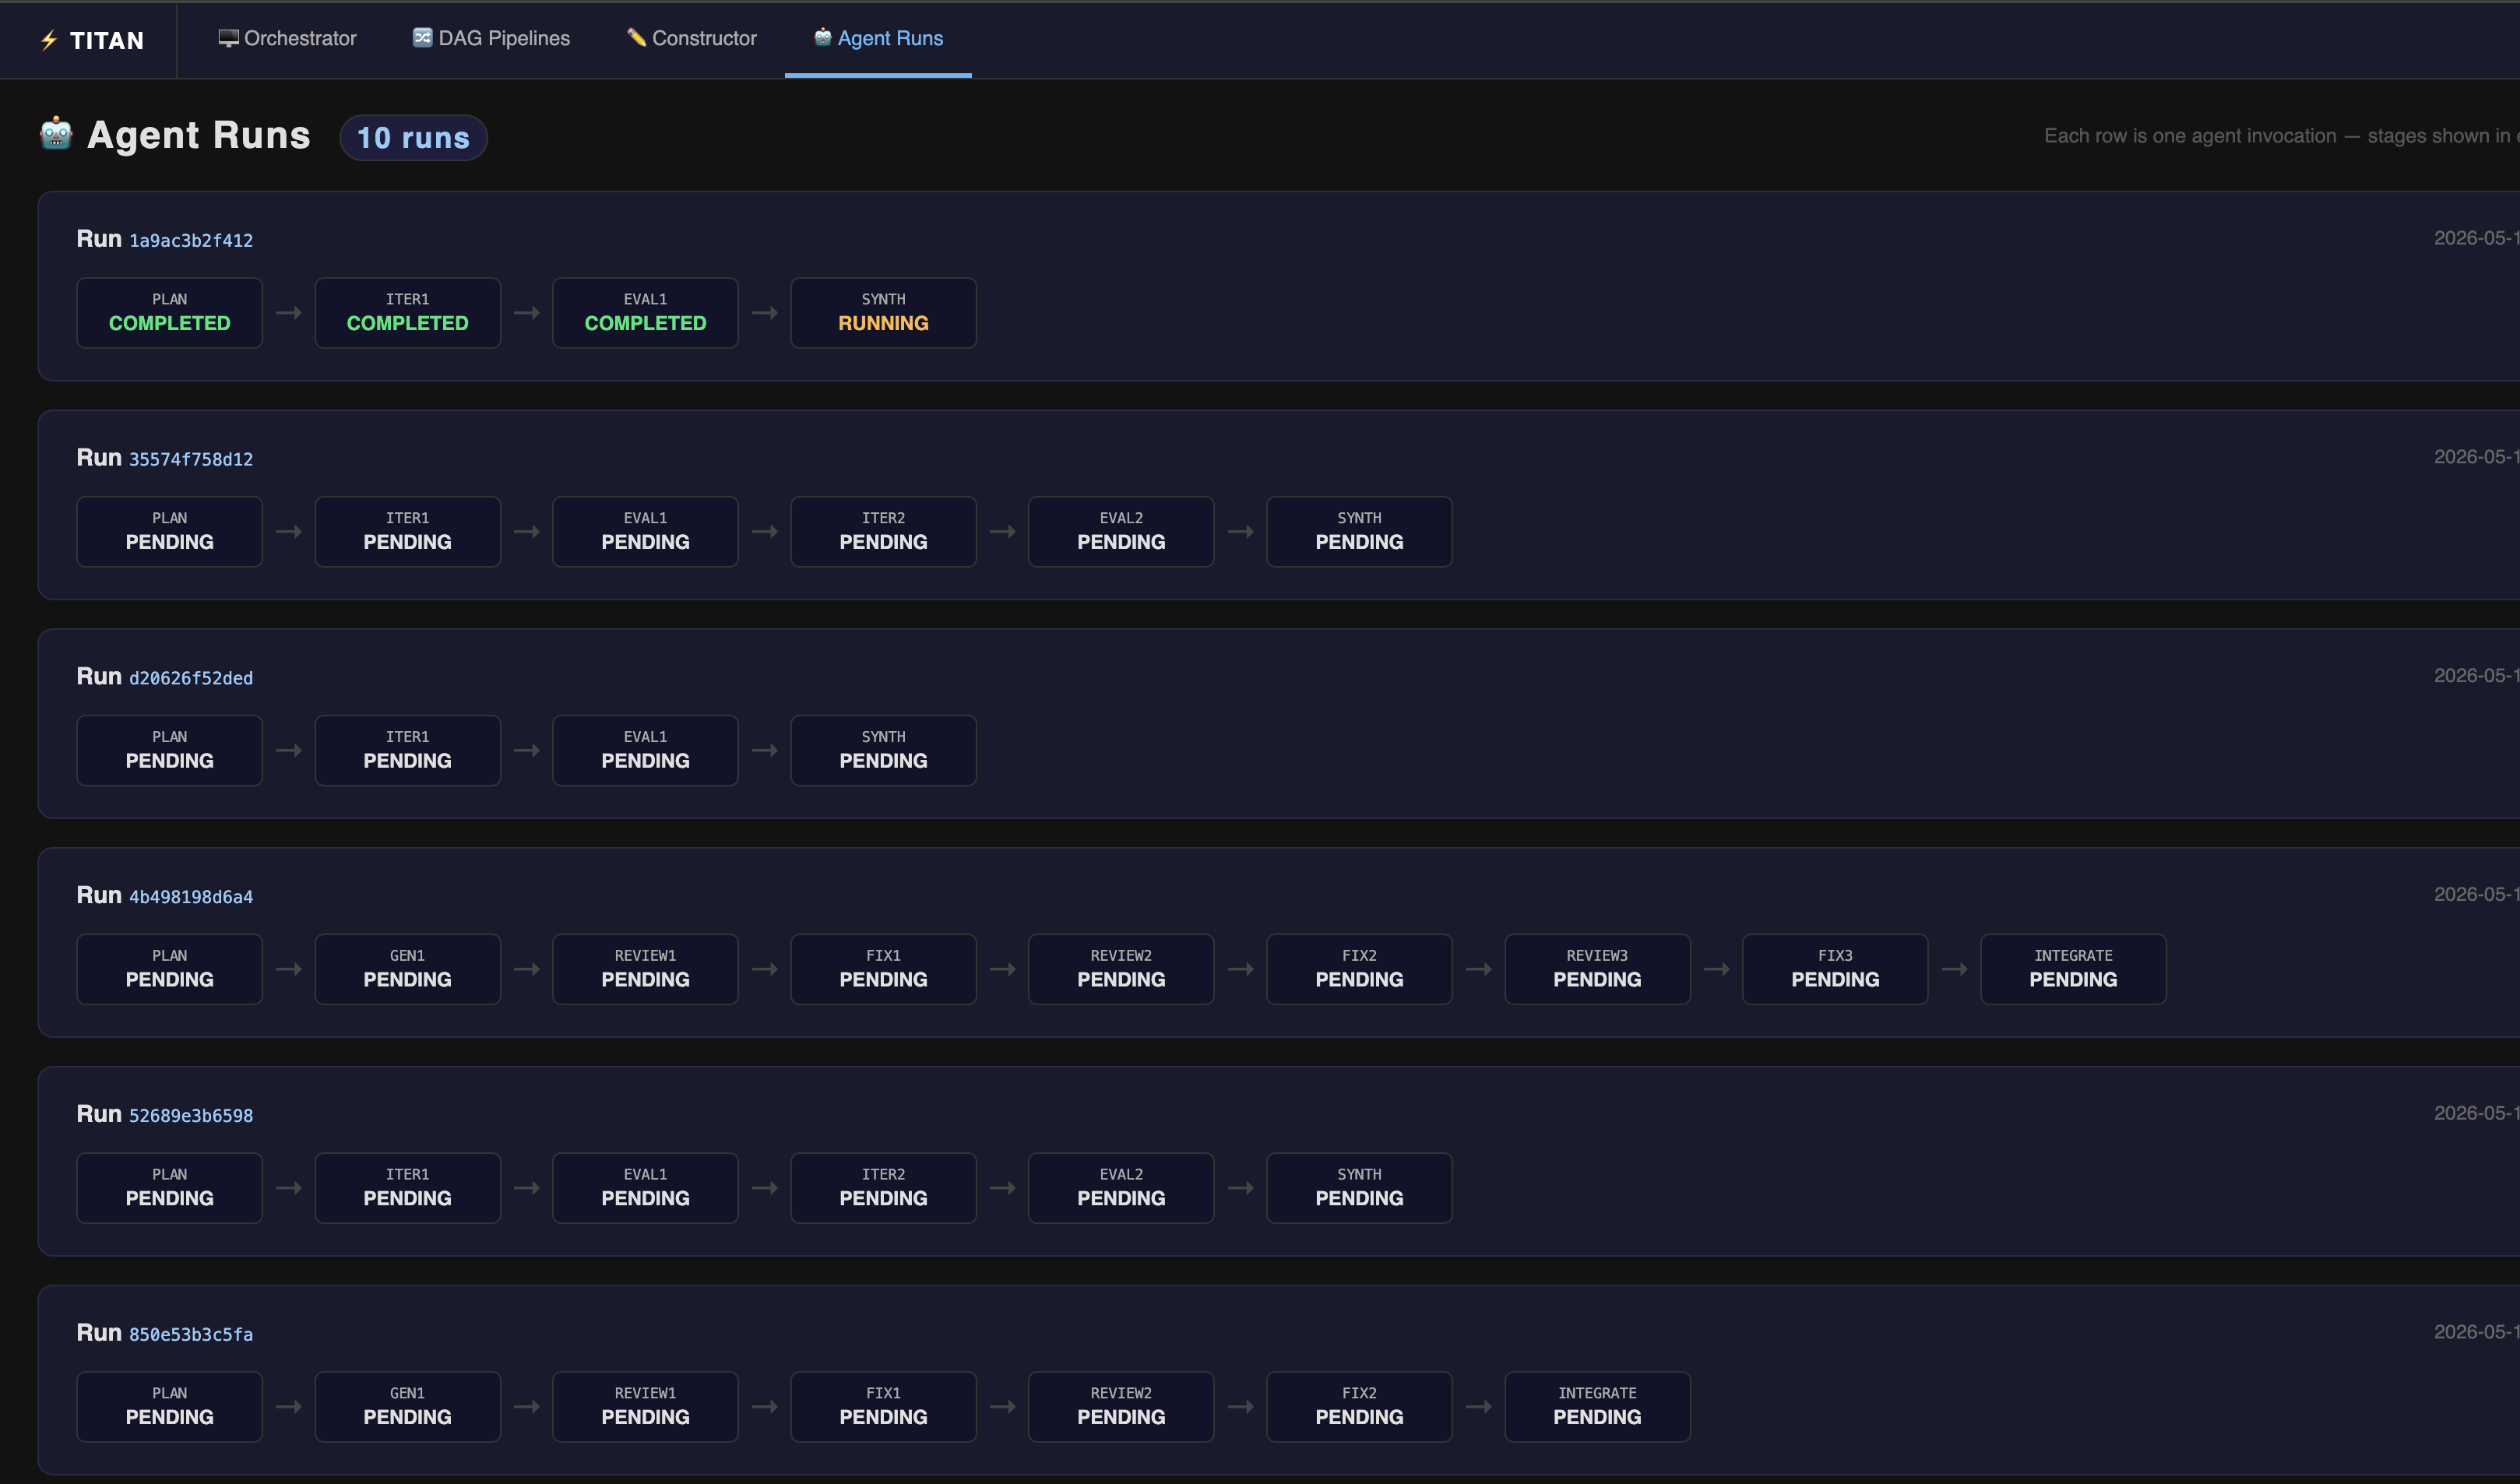
What it shows
Each row represents one agent invocation. Stages are shown left to right in submission order with arrows between them:
Each stage box shows:
- Stage label — the short name stripped of the common run ID prefix
- Status —
COMPLETED,RUNNING,FAILED,WAITING, orPARTIAL - Clicking a stage box navigates to that stage's DAG Visualizer
The page auto-refreshes every 3 seconds.
How to populate it
Pass an agent_run_id when submitting each stage of an agent:
from titan_sdk import TitanClient, TitanJob

client = TitanClient()

run_id = "RESEARCH_cb5e13"   # shared across all stages of this invocation

# Stage 1 — Plan
client.submit_dag(
    f"{run_id}_PLAN",
    [TitanJob(job_id="plan", filename="plan.py")],
    agent_run_id=run_id,
)

# Stage 2 — Execute (submitted after plan completes)
client.submit_dag(
    f"{run_id}_EXECUTE",
    [TitanJob(job_id="execute", filename="execute.py")],
    agent_run_id=run_id,
)
All DAGs submitted with the same agent_run_id are grouped under one row. The stages appear in the order they were submitted.
Tip
Use a unique ID per invocation — a short UUID or timestamp suffix works well:
Stage statuses
| Status | Colour | Meaning |
|---|---|---|
COMPLETED |
Green | All jobs in this stage finished successfully |
RUNNING |
Amber | At least one job is actively executing |
FAILED |
Red | One or more jobs failed |
PARTIAL |
Purple | Mixed — some completed, some failed |
WAITING |
Grey | No jobs have started yet |
When does a run appear?
Agent runs appear automatically as soon as the first stage with an agent_run_id is submitted. No manual configuration needed. The view is passive — if no agents have run yet, it shows an empty state.
Drilling into a stage
Click any stage box to open the full DAG Visualizer for that stage — showing its job graph, logs, and workspace files.
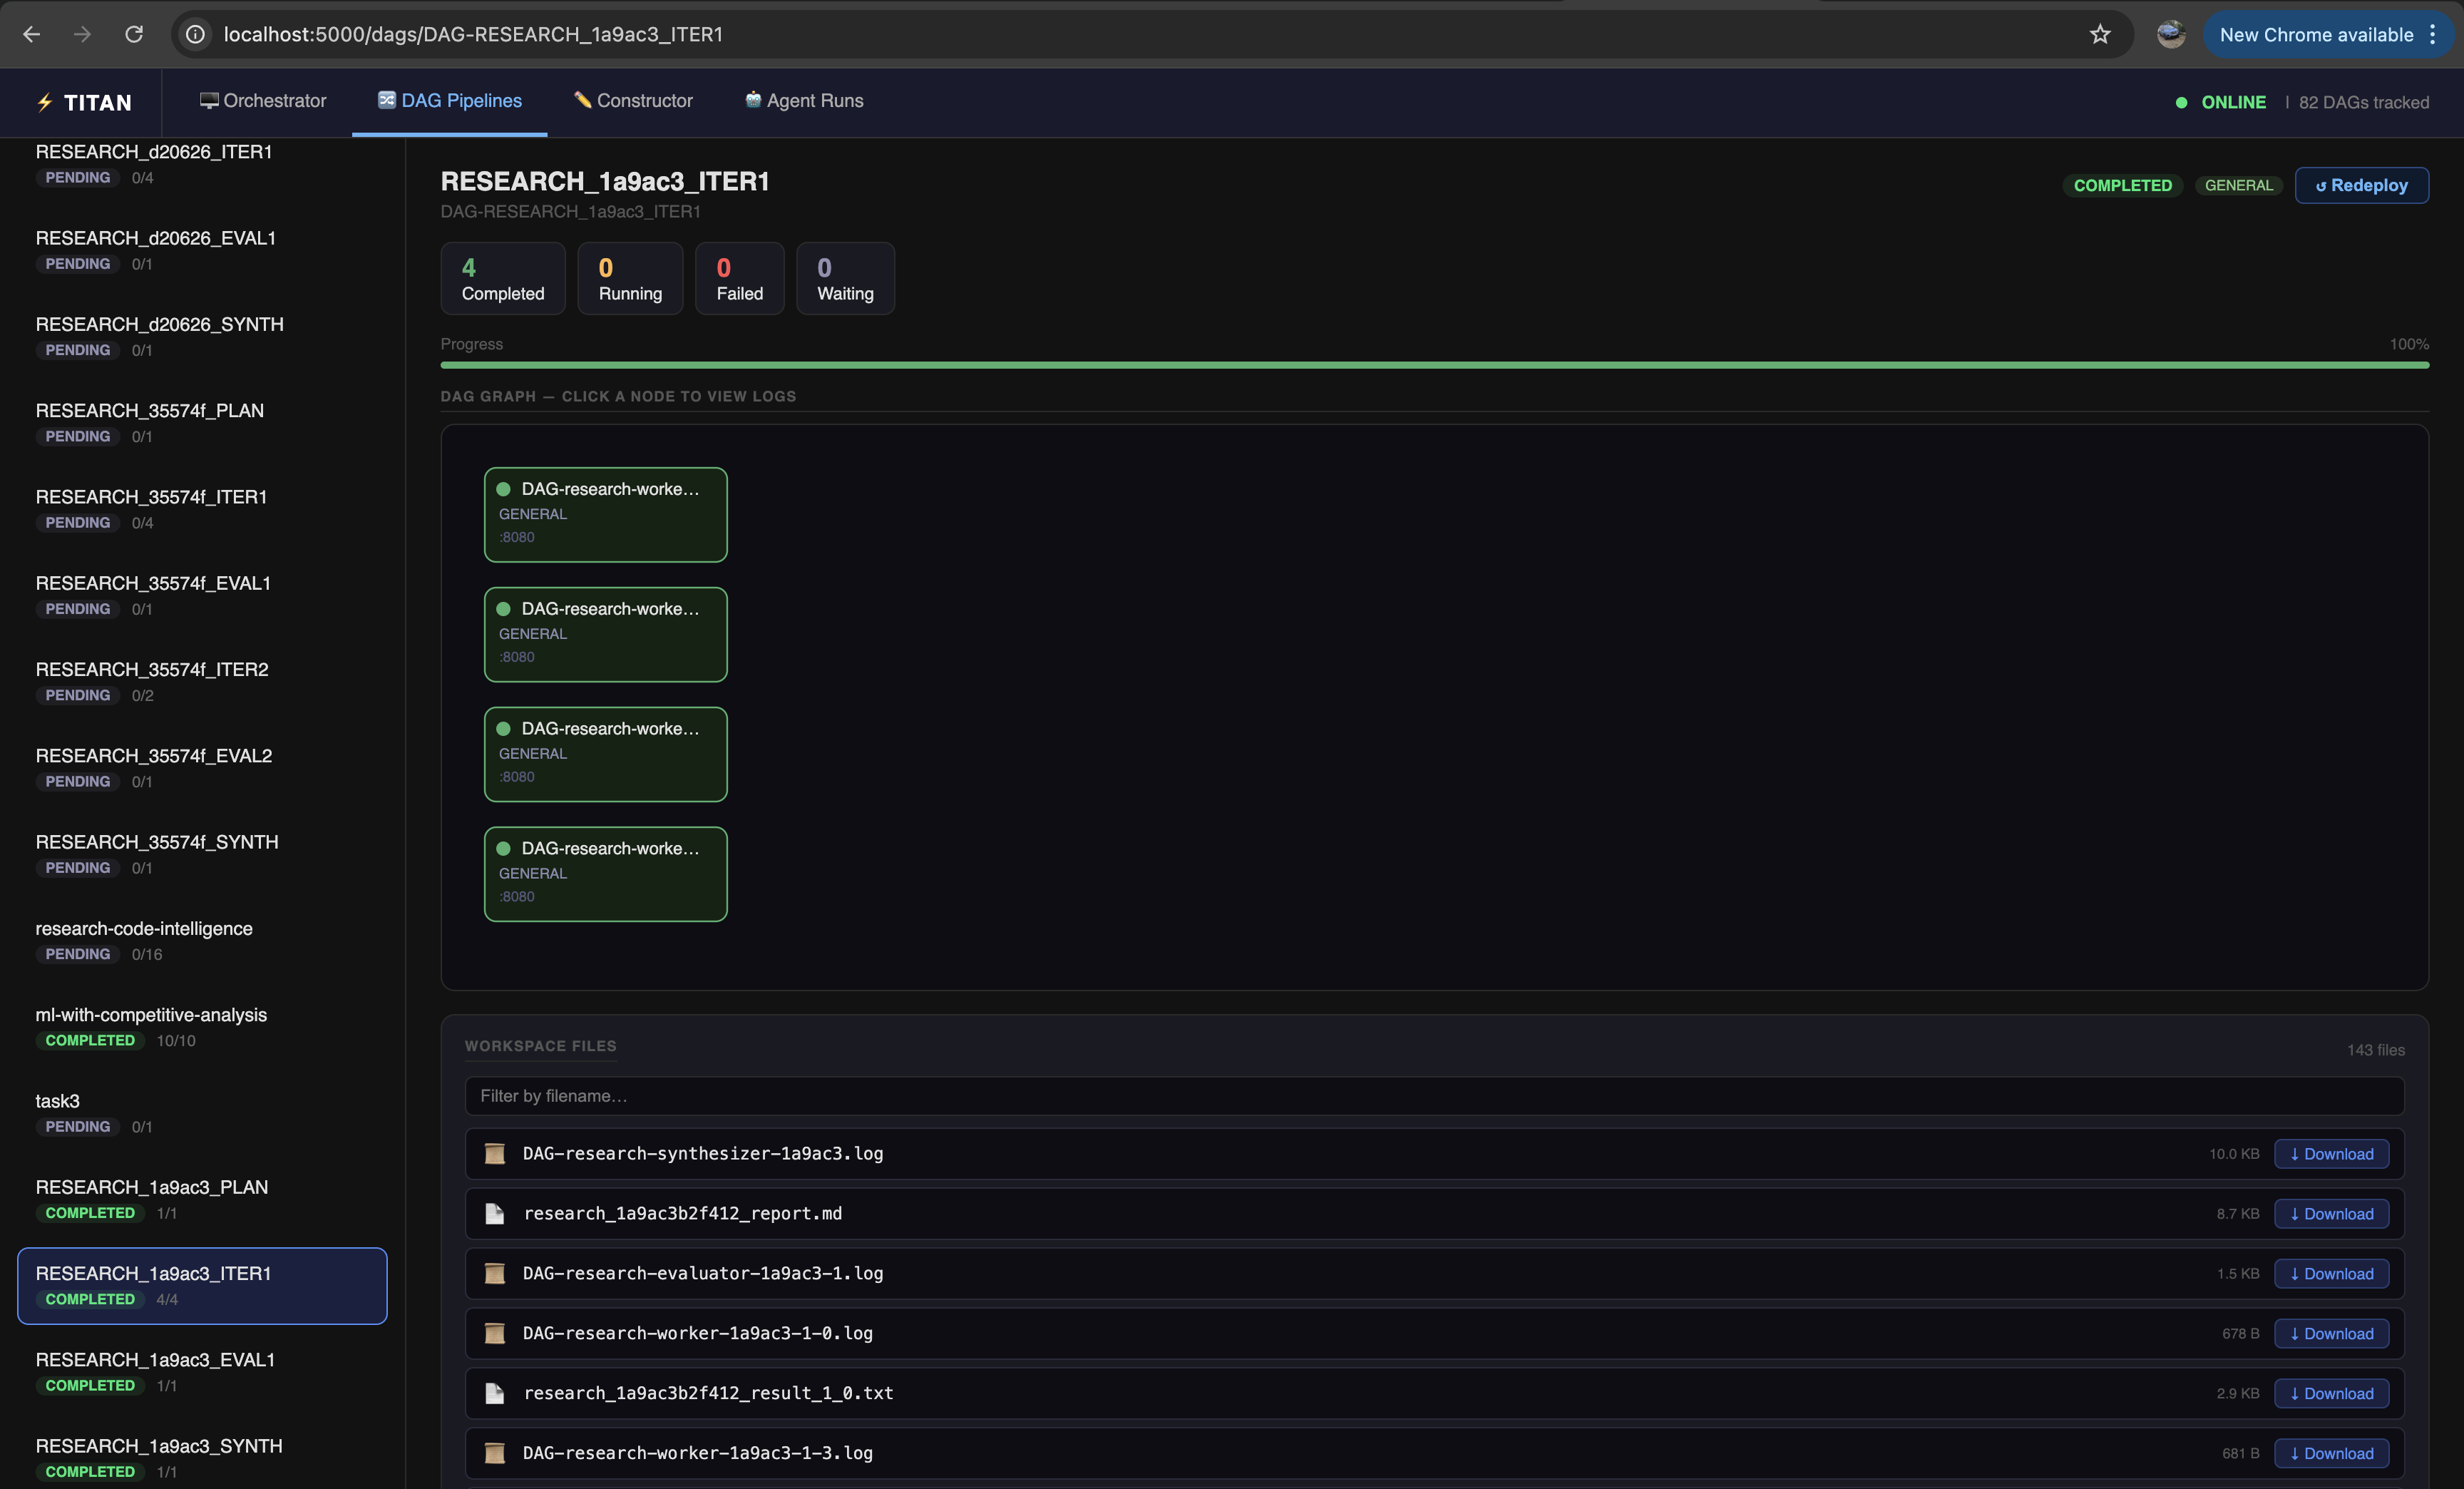
The URL follows the pattern /dags/DAG-<dag_name> — for example, the ITER1 stage of run 1a9ac3 opens at /dags/DAG-RESEARCH_1a9ac3_ITER1. From here you can inspect individual worker logs, download output files, and see exactly what each parallel worker produced.
Relationship to DAG Pipelines
Each stage in an Agent Run is also a full DAG visible in the DAG Pipelines view. Agent Runs is purely a grouping view — it does not change how the underlying DAGs execute. You can click any stage to drop into the full per-stage visualizer for logs, HITL gates, and workspace files.
Example — Multi-Agent Research Pipeline
The Multi-Agent Research Pipeline example produces an Agent Runs entry with stages like:
Each iteration is an independent DAG submitted with the same agent_run_id, so the Agent Runs view shows the full research loop at a glance.