DAG Visualizer — Overview
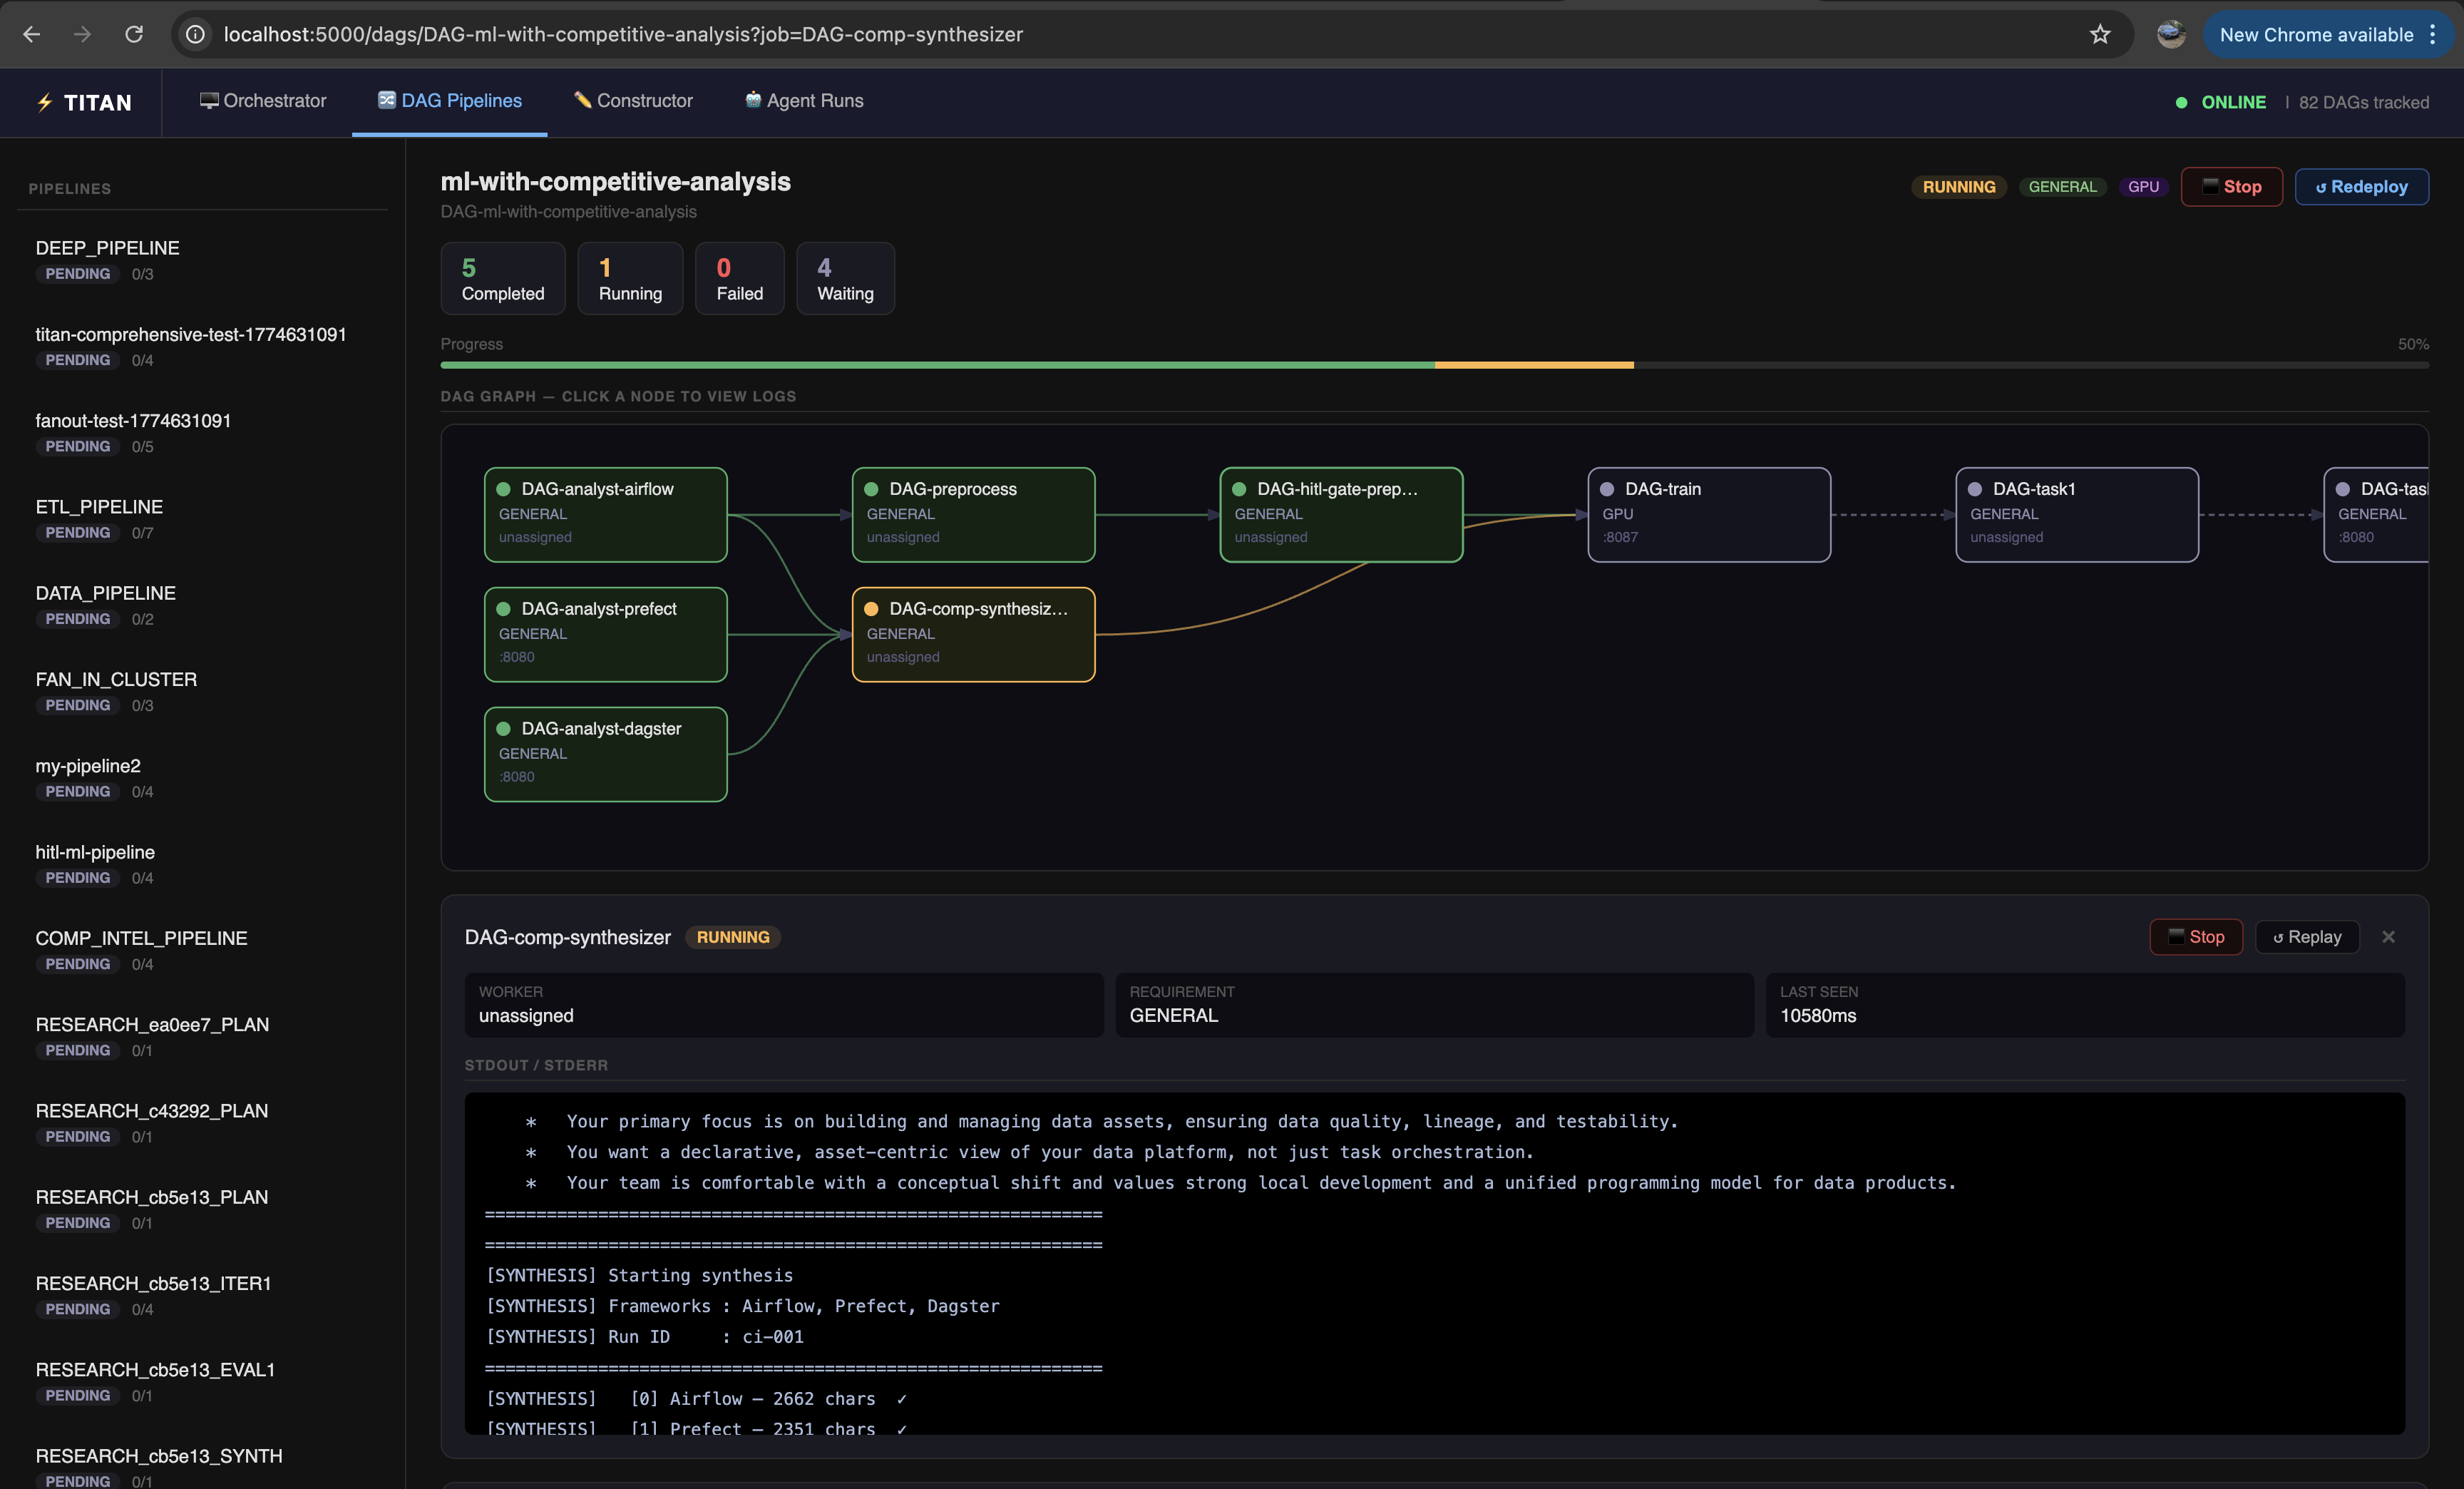
The DAG Visualizer is the live operational view for a submitted DAG. It shows the pipeline graph, real-time job status, logs, HITL approval controls, and output files — all in one place.
How to open it
From the constructor — after a successful deploy, click "✓ Deployed — View DAG →" in the topbar.
From the dashboard — go to http://127.0.0.1:5000/dags, find your DAG in the list, click its name.
Direct URL — http://127.0.0.1:5000/dags/DAG-<your-pipeline-name>
From the CLI — after titan submit, the CLI prints the DAG name. Append it to the dashboard URL.
From the SDK — after client.submit_dag(...), the DAG name is the prefix DAG- + the name you passed.
Layout
┌────────────────────────────────────────────────┐
│  DAG header — name, overall status, back link  │
├──────────────────┬─────────────────────────────┤
│                  │                             │
│  Pipeline graph  │  Job log panel              │
│  (SVG)           │  (appears on node click)    │
│                  │                             │
├──────────────────┴─────────────────────────────┤
│  HITL approval banner  (appears when pending)  │
├────────────────────────────────────────────────┤
│  Workspace Files panel                         │
└────────────────────────────────────────────────┘
Live polling
The visualizer polls the master every 2 seconds for job status updates. Node colors update in place without a page reload. You do not need to manually refresh.
Sections
- Monitoring & Logs — job status colors, clicking nodes to view logs
- HITL Approval — approving and rejecting gates at runtime
- Workspace Files — downloading output files generated by jobs